
Utility Consumption Monitoring for Sustainability

Improving operational efficiency is a longtime goal of process control and industrial applications, but today’s rising utility costs and widespread eco-conscious corporate initiatives are placing a new spotlight on energy savings in production facilities across all industries. Central to both operational efficiency and energy savings are the ability to squeeze as much production or output from the smallest net input possible, while maintaining high safety, quality, reliability and uptime.
Utilities can be broadly placed into two camps. Tier-one utilities are typically purchased directly from an external supplier, including electricity, water, liquid fuel and various industrial gases. These are used directly to power many operational components within a facility, but additional general-purpose products are also required to run particular processes such as purging or cooling. These tier-two utilities—created from tier-one supplies—include steam, compressed air, treated water and heat.
The use of utilities is directly correlated with profits and carbon footprint, incentivizing companies to minimize consumption, while upholding safety and quality. Utilities are a necessary expenditure, but there are almost always opportunities for savings, which can help companies reduce operational costs, increase product margins and meet ambitious environmental stewardship targets. However, proper energy management requires accurate data capture and appropriate analysis.
None of this is possible without reliable instrumentation to monitor plant processes and utility consumption. This information empowers plant personnel to establish baselines, monitor process efficiency, identify opportunities for savings and optimize operations.
Reduce operational costs to become more competitive
Organizations can reduce their operating costs by saving energy wherever possible, thereby increasing competitiveness. However, many companies are still unaware of how much energy they actually consume. This and other issues can be resolved by implementing an energy management system with the right instrumentation.
There are many areas for potential savings in steam, compressed air, heating, cooling and industrial gas usage. These are common process inputs for plant operation in many industry sectors, and vast quantities of energy are expended in the production and distribution of these utilities. This is why identifying opportunities for consumption reduction in plant processes is so critical.
Steam, for example, drives heat exchangers, distillation column reboilers, and similar applications because it is an efficient and controllable mechanism for delivering energy exactly where it is needed. But it is also expensive to produce and distribute, calling for careful measurement and control.
Comprehensive utility monitoring and optimization can regularly reduce energy consumption by 5 to 15 percent, but this requires establishing the right energy performance indicators (EnPIs) and making appropriate process operational tweaks or investments. All reduction opportunities depend on instrumentation that can objectively quantify energy flows, energy consumption and process data according to ISO 50001 and ISO 50006, with related systems presenting this data in terms of EnPIs.
Guiding standards
ISO 50001 is a universal energy management standard, specifying the establishment of EnPIs for setting up an energy management system. These indicators must be regularly reported, checked and compared against an energy baseline (EnB) created prior to introducing measures for increased energy efficiency (Figure 1).
On the basis of this information, potential areas for savings are evaluated, and improvement measures can be initiated for single processes as well as throughout buildings, plants, or entire factory complexes.
The ISO 50006 standard provides stepby-step guidance to companies for defining robust EnPIs and an accurate EnB for later comparison. The standard also contains several real-life examples, which are helpful because it can be difficult to initially identify relevant variables in an energy system from which to determine EnPIs. Such variables include weather conditions, balance period, plant size, production variations and energy sources, to name a few.
Common EnPI examples include:
Total primary energy consumption (MWh/ year)
Improvement in energy intensity for the baseline year (percent)
Adjustment for primary energy demand (MWh/year)
Energy savings for the current year (MWh/ year)
Energy savings since the baseline year (MWh/year)
Improvement in energy intensity for the current year (percent)
Total consumed primary energy (MJ/year)
Electricity, water or fuel consumption (total values, peak loads, etc.)
Specific energy consumption, i.e., energy consumption per quantity of produced media, like compressed air (kWh/Nm3), steam (MJ/t) and hot water (kW/kg)
Efficiency of steam boilers (percent).

-
 GE SR745-W2-P1-G1-HI-A-L-R-E Feeder protection relay
 -
 GE IS230TNDSH2A Discrete Output Relay Module Brand
 -
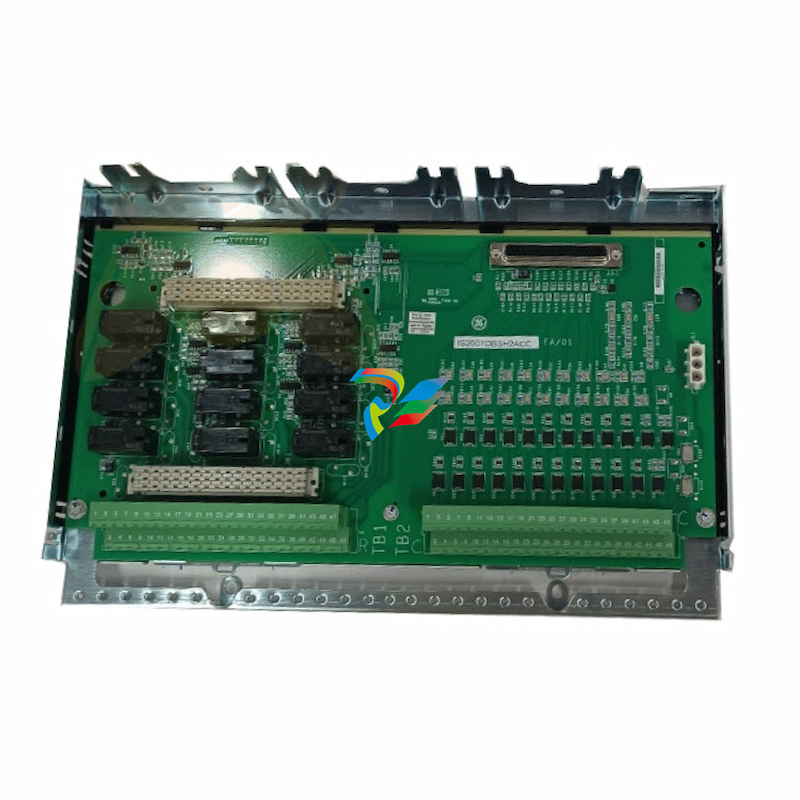 GE Fanuc IS200TDBSH2ACC Mark VI Terminal Board Brand
 -
 GE PMC-0247RC-282000 350-93750247-282000F Disk Drive
 -
GE PMC-0247RC-282000 350-93750247-282000F Disk Drive
-
 GE VMIVME-1150 Serial Communications Controller
 -
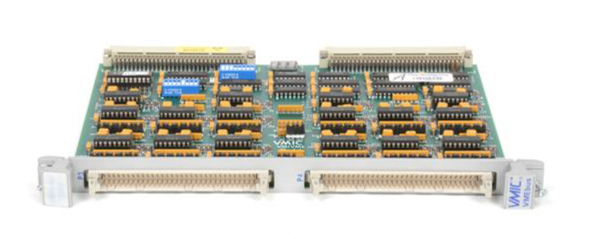
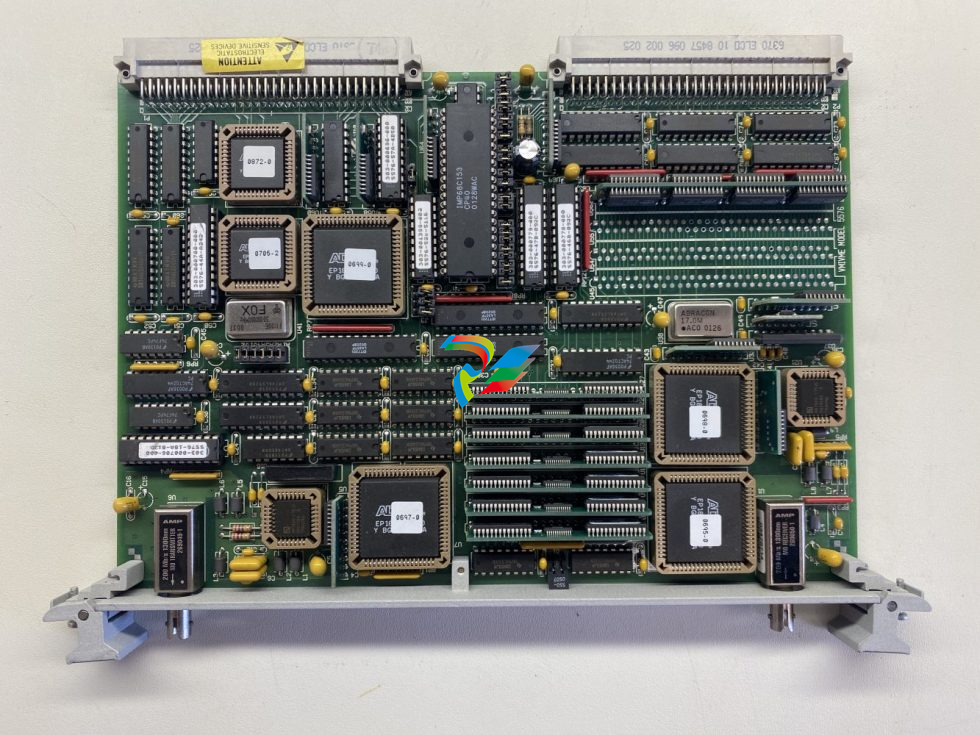 GE VMIVME-5576 Fiber-Optic Reflective Memory with Interrupts
 -
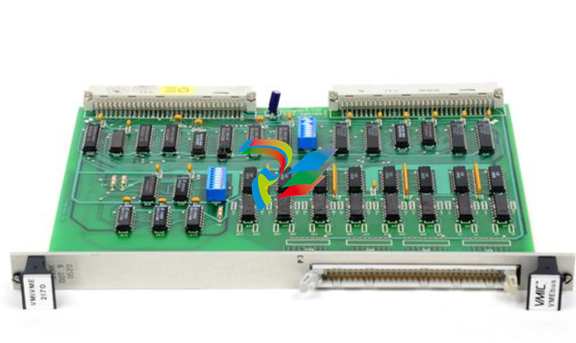 GE VMIC Isolated Digital Output VMIVME-2170A
 -
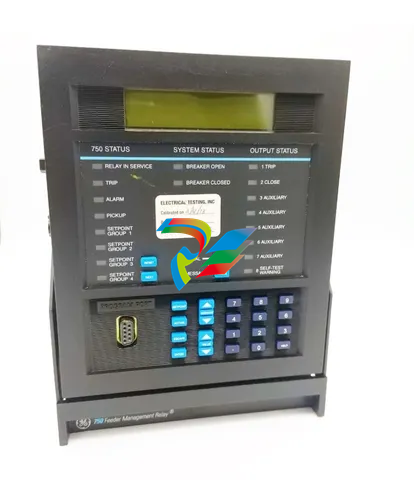 GE MULTILIN 760 FEEDER MANAGEMENT RELAY 760-P5-G5-S5-HI-A20-R-E
 -
 GE IS200AEPAH1BKE IS215WEPAH2BB Printed circuit board
 -
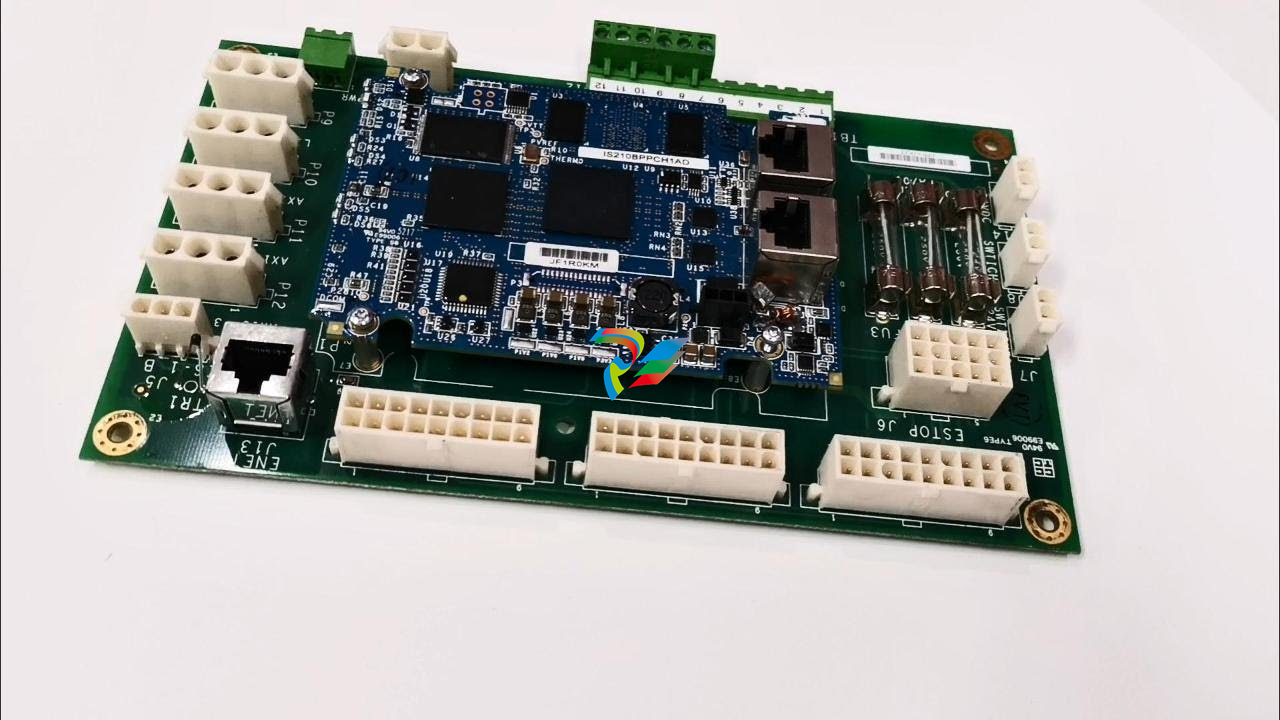 GE IS210BPPCH1A Mark VIe I/O Pack Processor Card
 -
 GE IS220PRTDH1A 336A4940CSP6 High-Performance RTD Input Module
 -
GE IS220PDIAH1BE 336A5026ADP4 Discrete Input Module
-
 GE IS420ESWBH3A IONET Switch Module
 -
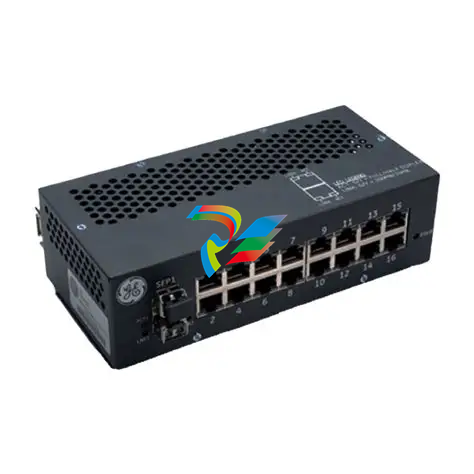
 GE 516TX 336A4940DNP516TX 16-port Ethernet switch
 -
 GE EVMECNTM13 Embedded control module
 -
 GE EVPBDP0001 EVPBDP032 control module
 -
 GE Hydran M2-X Enhanced Monitoring with Extended Sensor Life
 -
 GE UR6CH Digital I/O Module
 -
 GE IC695CPU315-CD Central processing unit
 -
 GE 531X305NTBAMG1 DR Terminal Board
 -
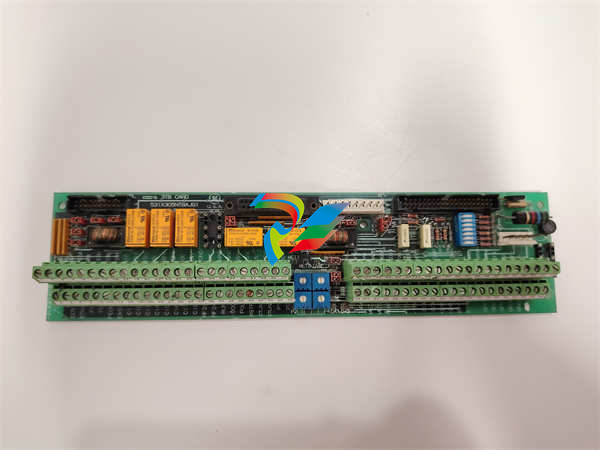
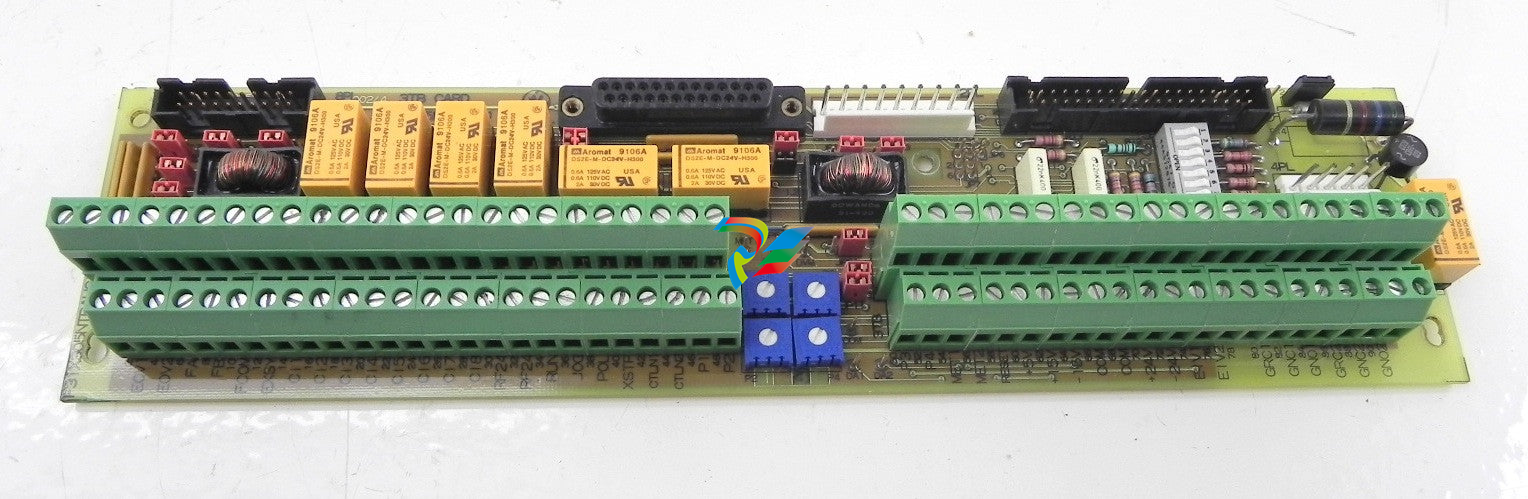
 GE 531X305NTBALG1 NTB/3TB Terminal Board 531X Series
 -
 GE 531X305NTBAJG1 NTB/3TB Terminal Board.
 -
 GE 531X305NTBAHG1 NTB/3TB Terminal Board 531X
 -
 GE 531X305NTBAEG1 is a PCB that functions as a DR terminal board.
 -
General Electric 531X305NTBACG1 NTB/3TB Terminal Board 531X
-
 GE Digital Energy D20 Analog Input Module
 -
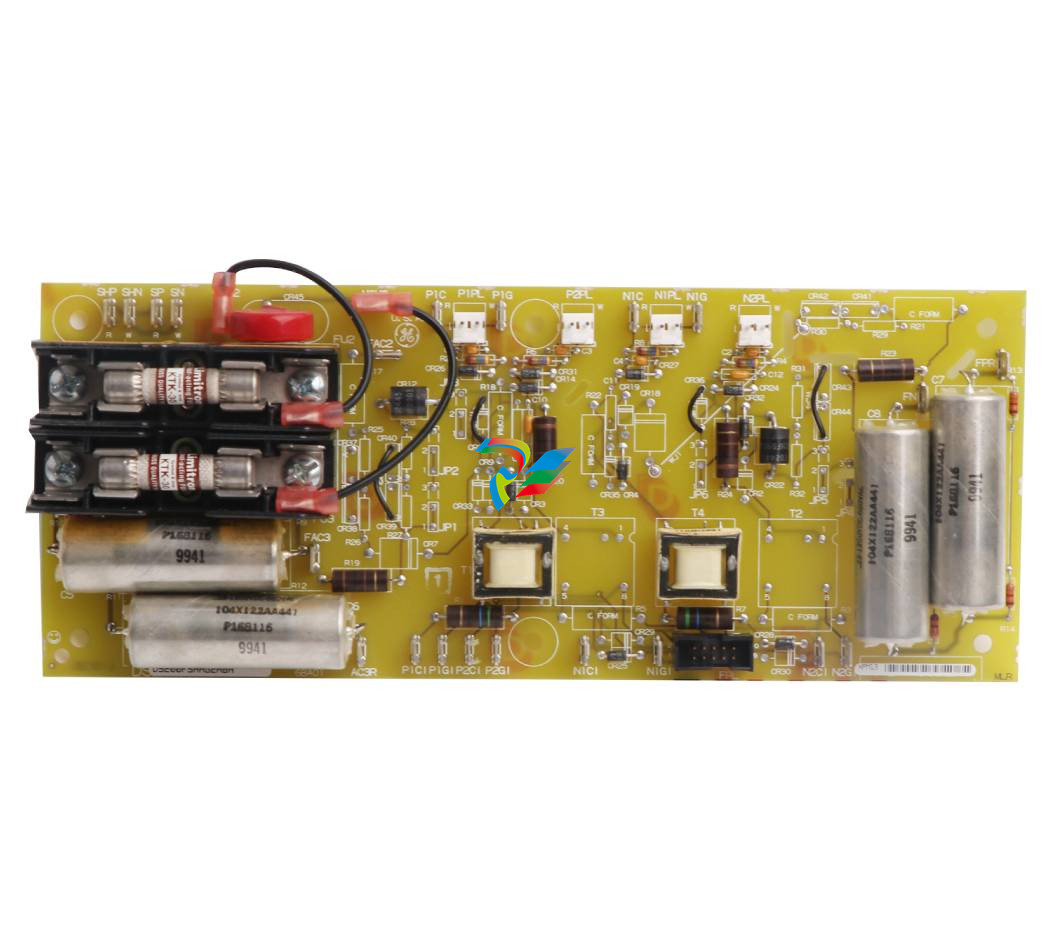
 GE 94-164136-001 main board Control board
 -
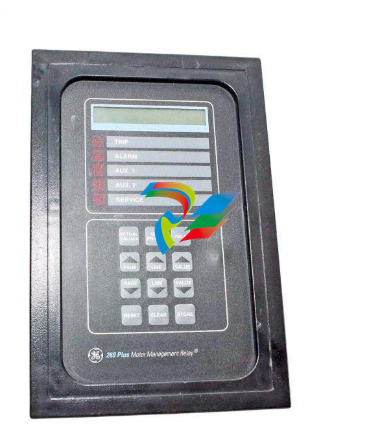 GE 269 PLUS-D/O-100P-125V Digital motor relay
 -
 GALIL DMC-9940 High-performance motion controller
 -
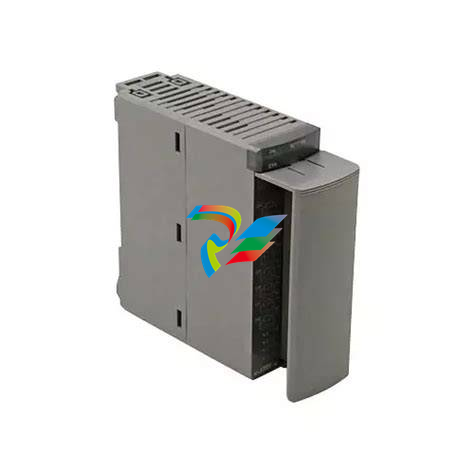
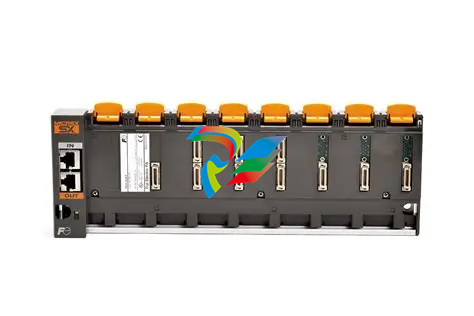 FUJI NP1BS-08 base plate
 -
 FUJI NP1Y32T09P1 Transistor drain type digital output module
 -
 FUJI NP1Y16R-08 Digital Output Module
 -
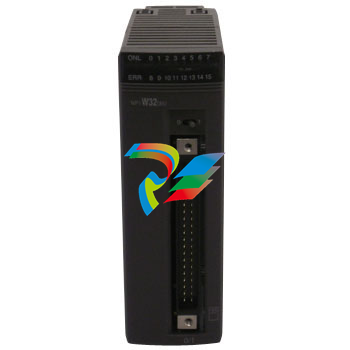
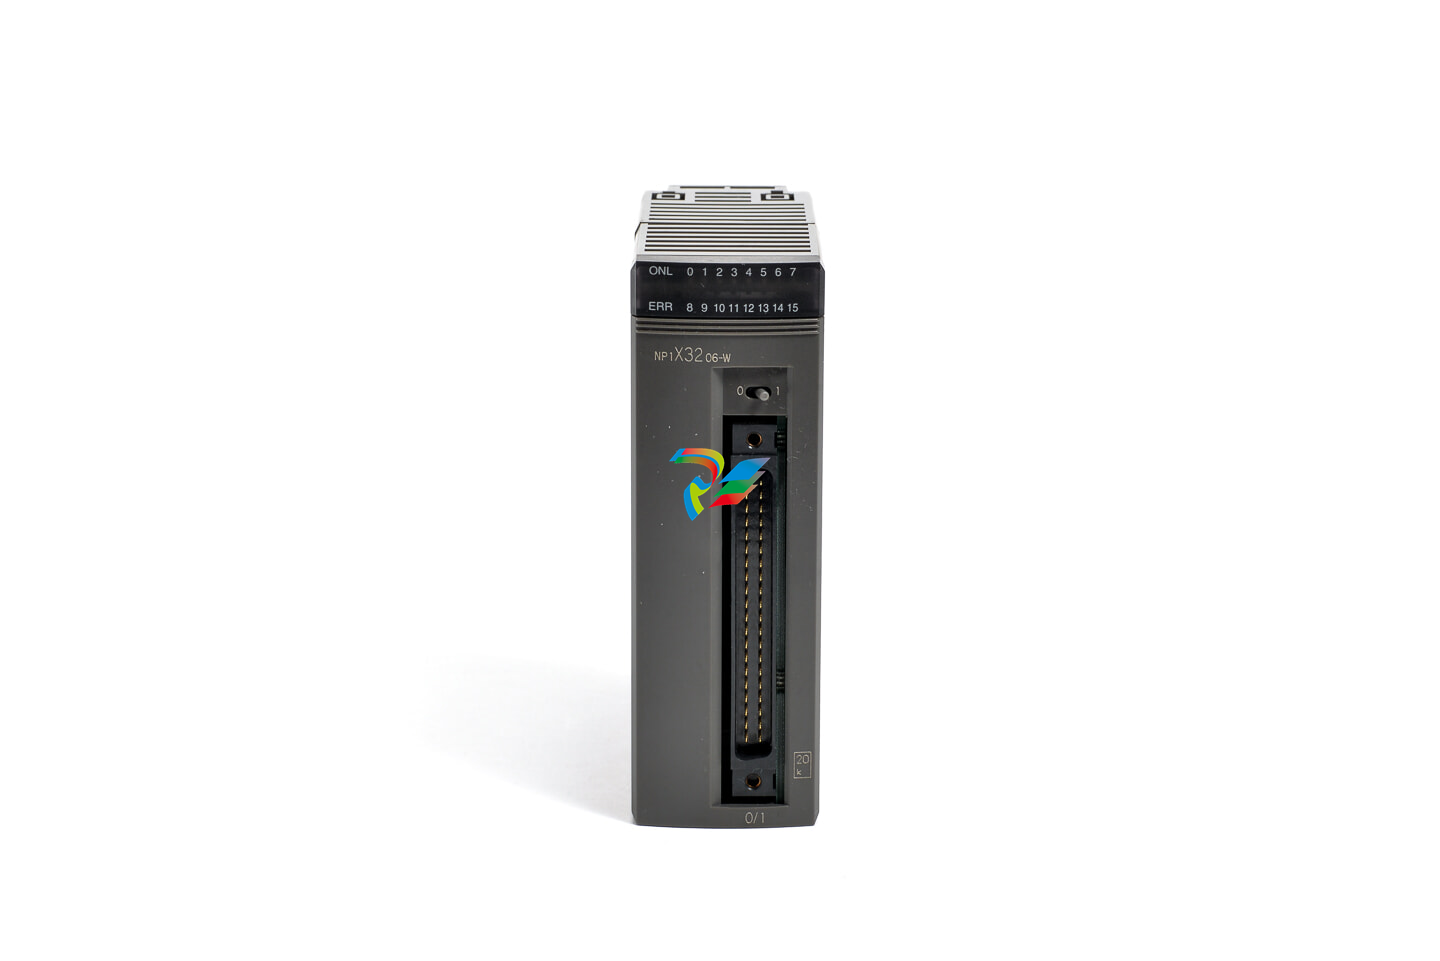 FUJI NP1X3206-A High-speed digital input module
 -
 FUJI NP1AYH4I-MR current output module
 -
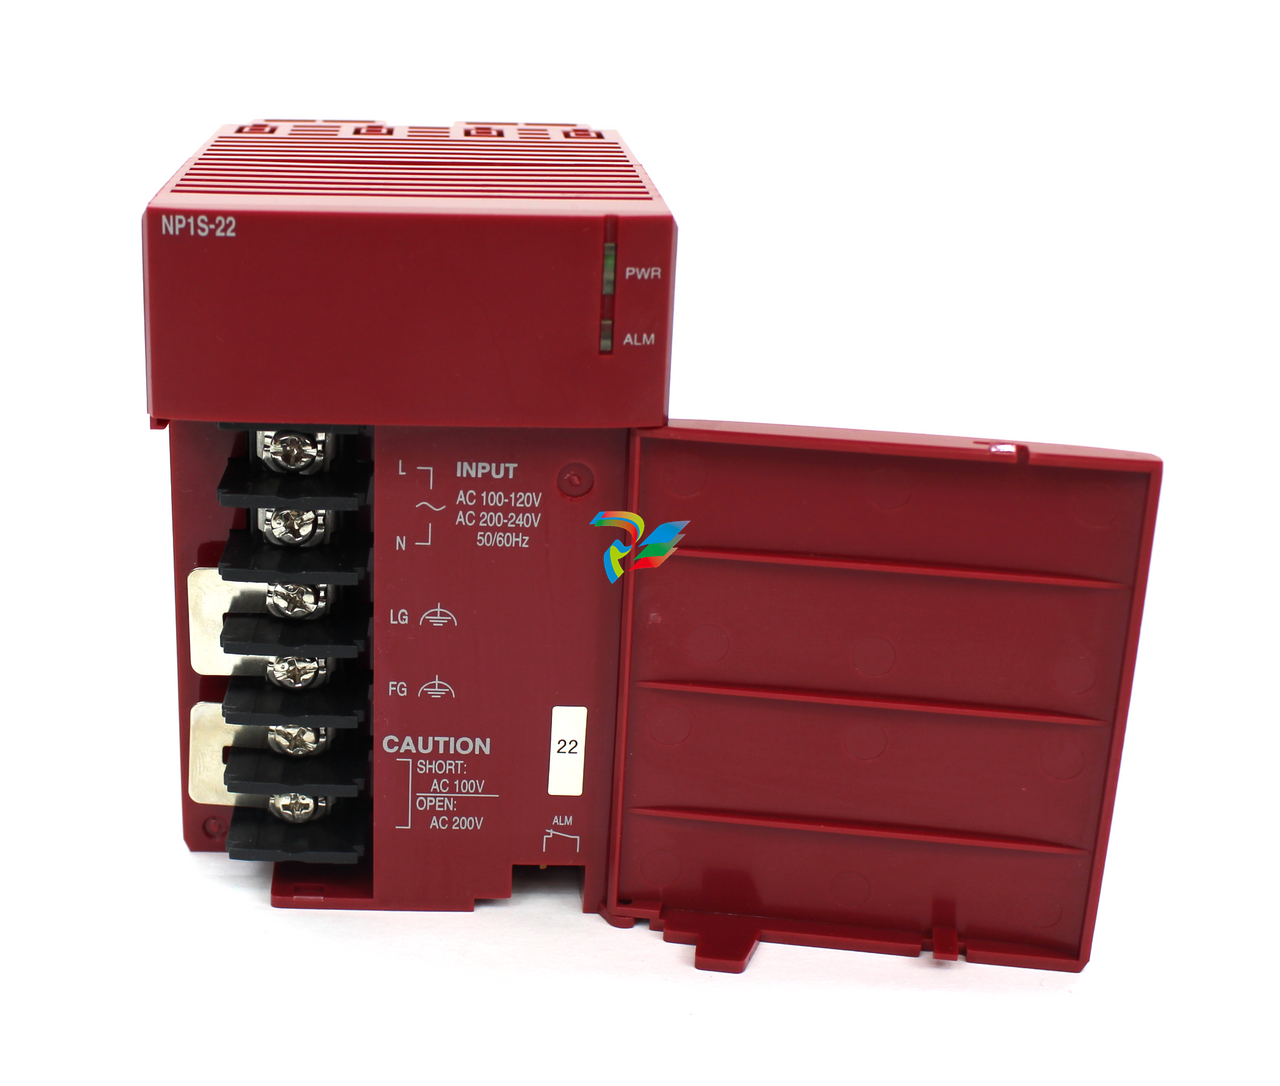 FUJI NP1S-22 Power module redundancy
 -
 FUJI RPXD2150-1T servo drive module
 -
 FUJI FVR008E7S-2UX Ac frequency converter
 -
 FUJI Ac frequency converter FVR008E7S-2
 -
 FUJI FVR004G5B-2 Small general-purpose frequency converter
 -
 FUJI A50L-2001-0232 Industrial control module
 -
 FUJI A50L-001-0266#N High-performance servo amplifier
 -
 Honeywell FS7-2173-2RP Gas sensor
 -
 Honeywell 10106/2/1 Digital Input Module in Stock
 -
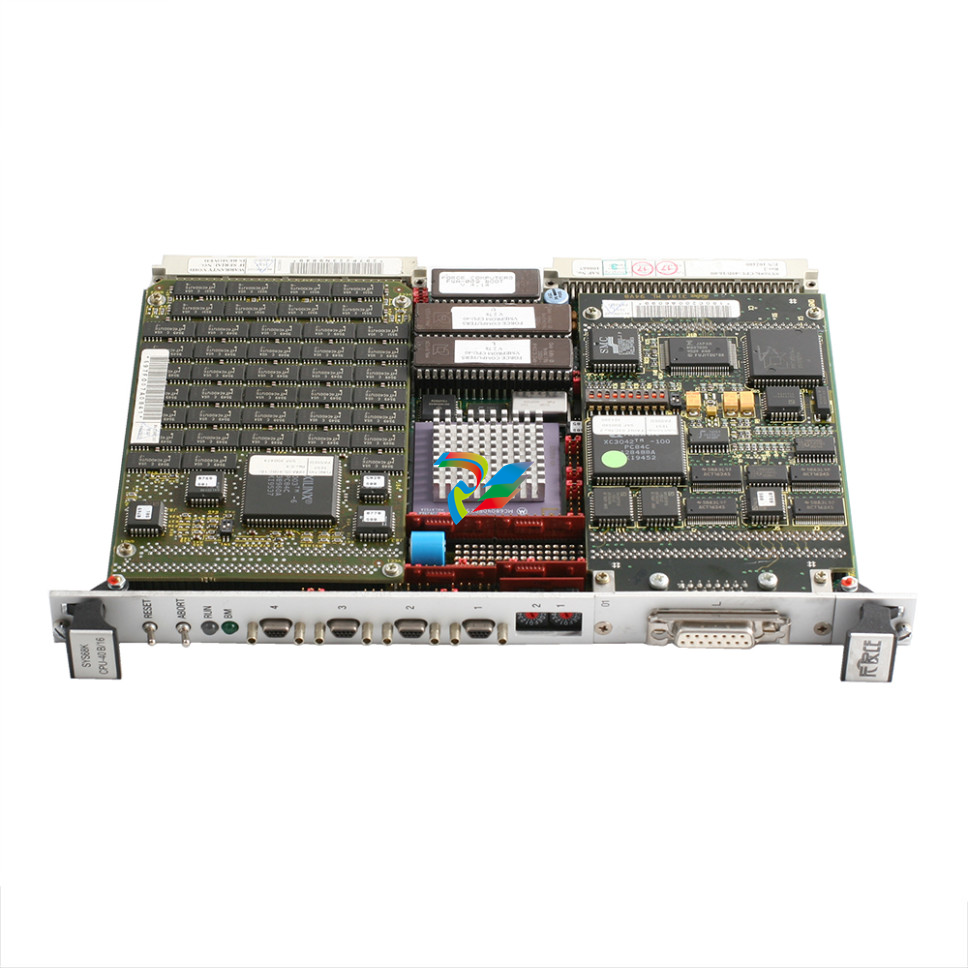 FRCE SYS68K CPU-40 B/16 PLC core processor module
 -
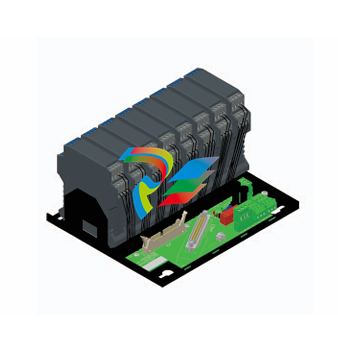 Foxboro FBM I/O cards PBCO-D8-009
 -
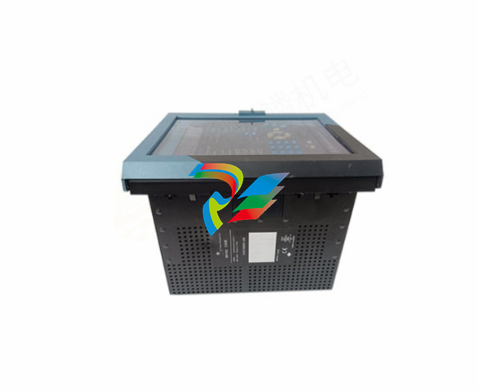
 Foxboro AD916AE Digital Control System (DCS) Module
 -
 GE SR750-P5-G5-S5-HI-A20-R-E Multilin Relay
 -
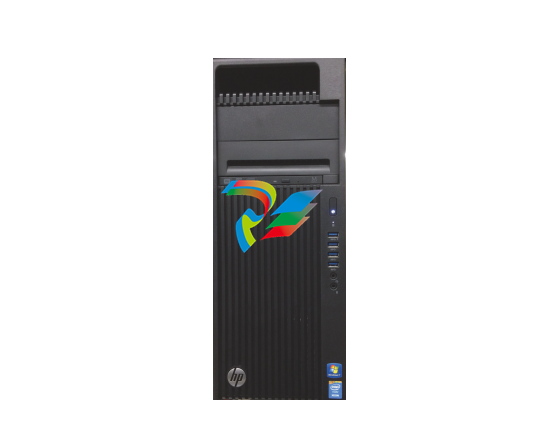
.jpg) FOXBORO H90 H90C9AA0117S Industrial Computer Workstation
FOXBORO H90 H90C9AA0117S Industrial Computer Workstation -
.jpg) FOXBORO RH928AW | I/A Series Relay Output Module
FOXBORO RH928AW | I/A Series Relay Output Module -
.jpg) Foxboro N-2AX+DIO Multi-functional input/output module
Foxboro N-2AX+DIO Multi-functional input/output module -
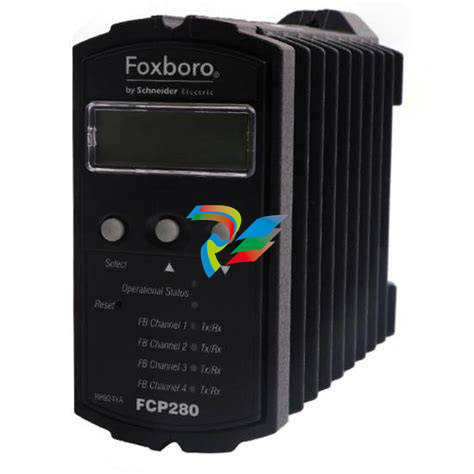 Foxboro RH924WA FCP280 Fiber Optic Network Adapter
 -
 FOXBORO H92 Versatile Hardware Component In
 -
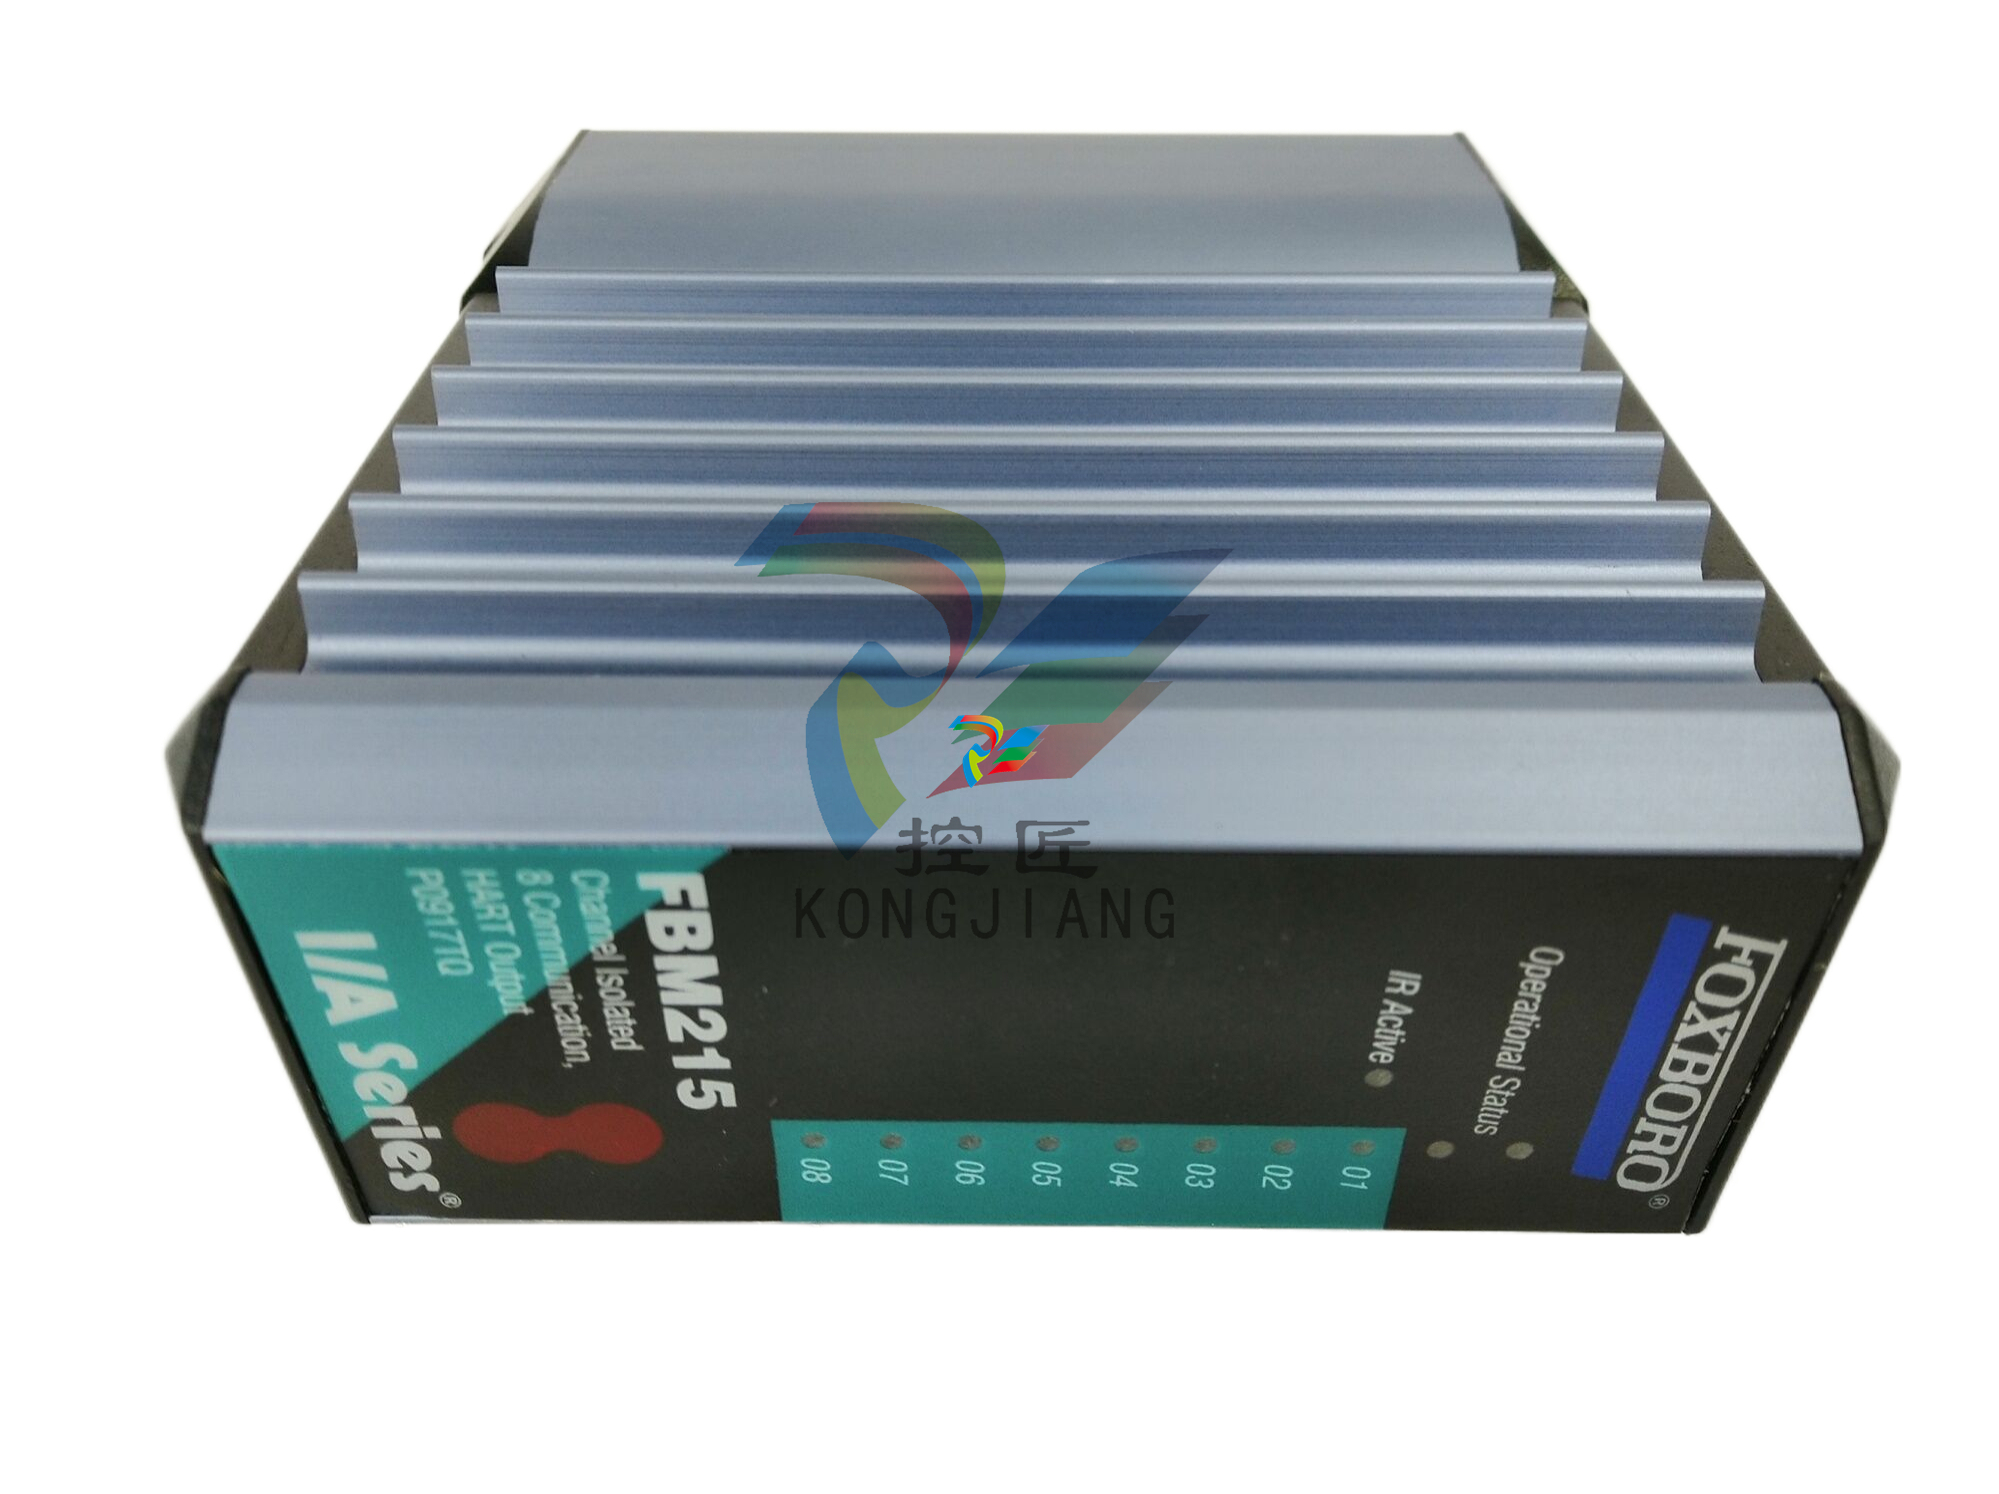
 Foxboro FBM218 P0922VW HART® Communication Redundant Output Interface Module
 -
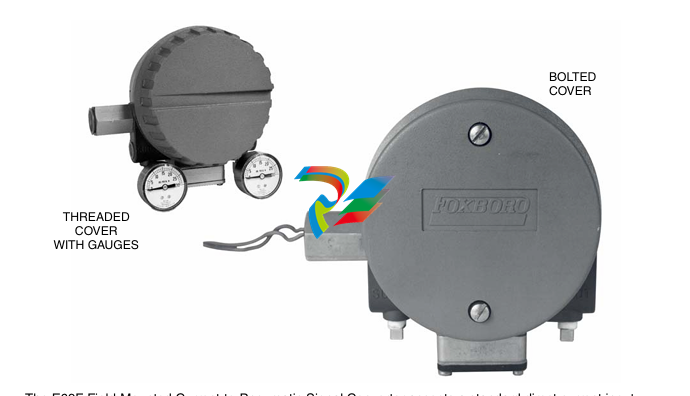
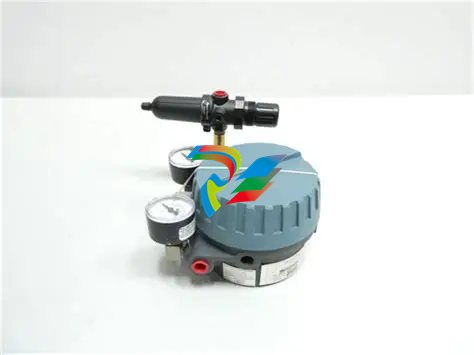
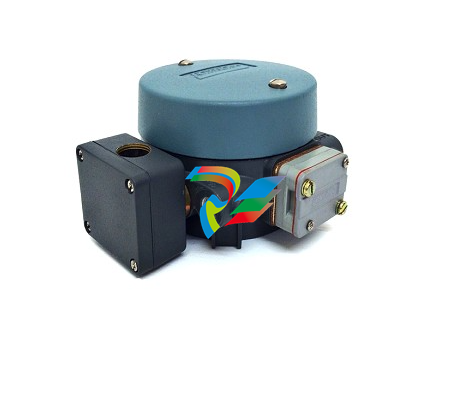 Foxboro E69F-TI2-J-R-S E69F Series Current-To-Pneumatic Signal Converter
 -
 Foxboro E69F-BI2-S Converter
 -
.jpg) Foxboro H92A049E0700 The host of the DCS control station
Foxboro H92A049E0700 The host of the DCS control station -
 Foxboro H90C9AA0117S Industrial computer workstation
 -
 Foxboro RH101AA High-performance industrial control module
 -
 Foxboro P0922YU FPS400-24 I/A Series Power supply
 -
.png) FOXBORO P0973LN Chassis-based managed switch with independent power supply
FOXBORO P0973LN Chassis-based managed switch with independent power supply -
.jpg) FOXBORO P0926PA Input/output module
FOXBORO P0926PA Input/output module -
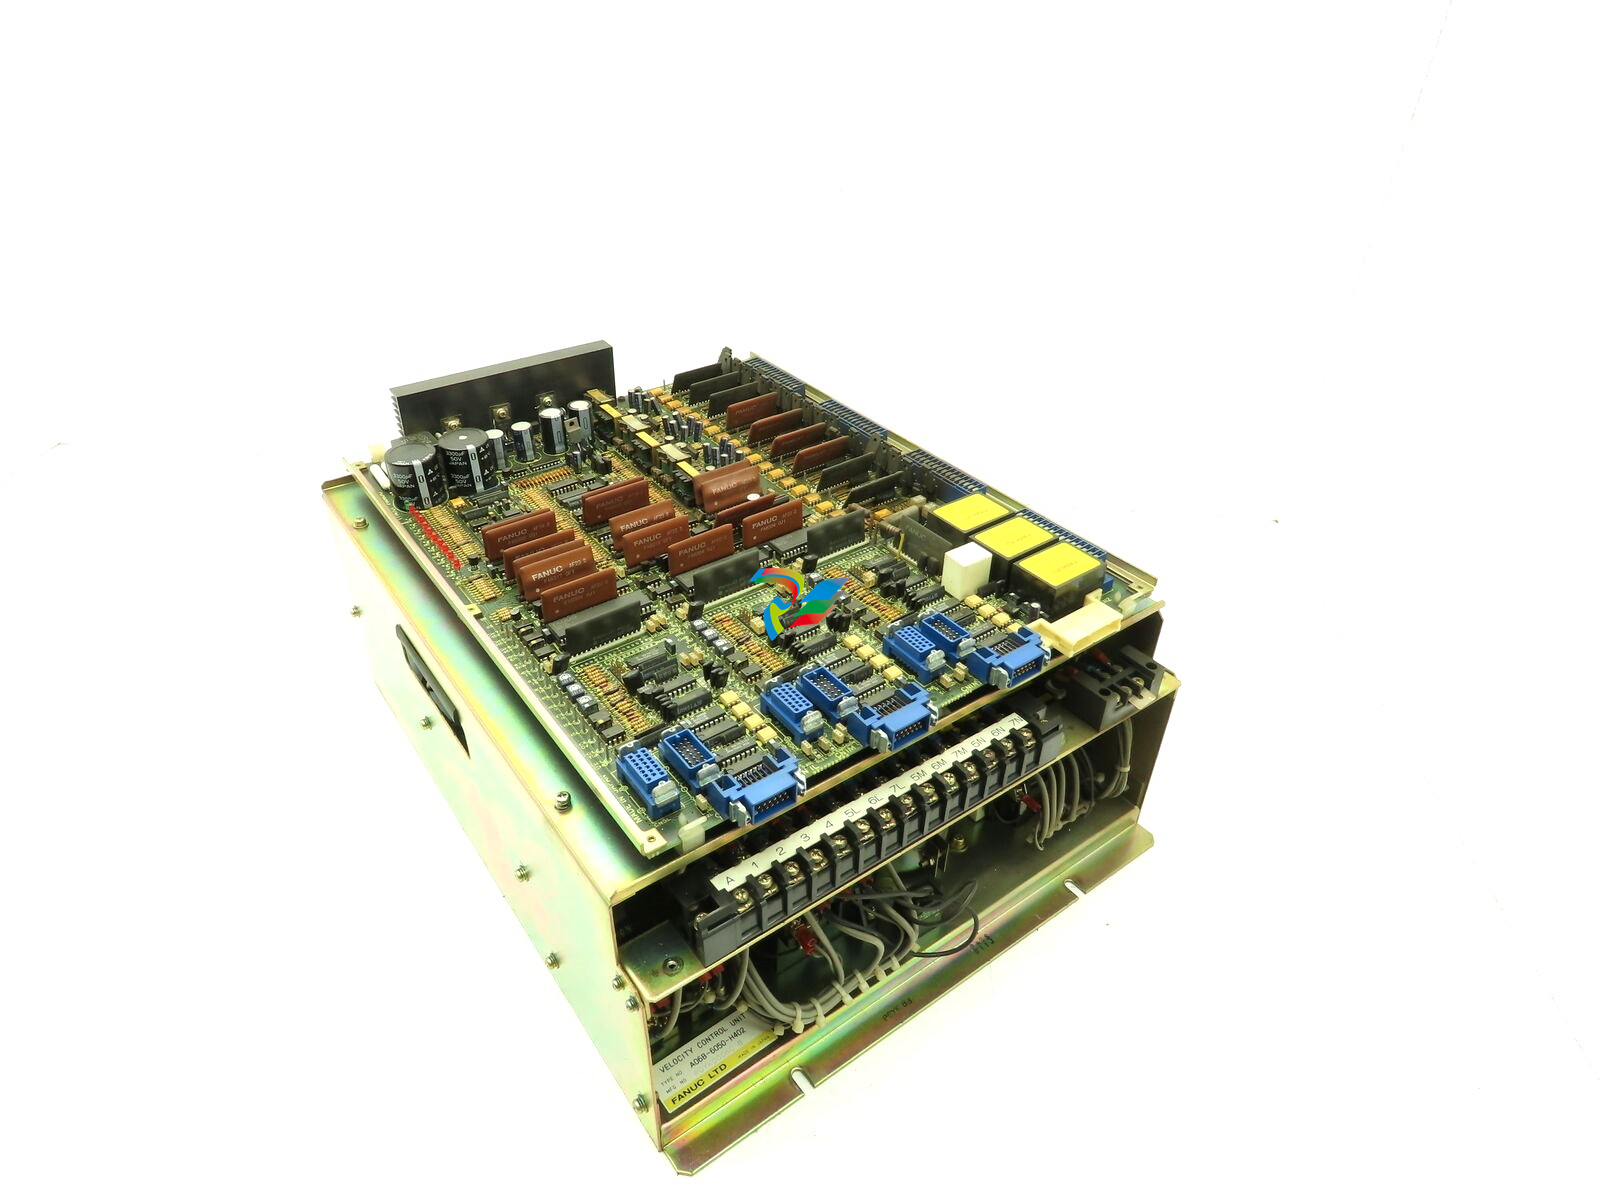 Fanuc A06B-6050-H402 3 AXIS ANALOG AC SERVO DRIVE
 -
.jpg) FOXBORO L0130AD L0130AE-0H Power module group
FOXBORO L0130AD L0130AE-0H Power module group -
_lVjBYb.jpg) FOXBORO 0399085B 0303440C+0303458A Combination Control Module
FOXBORO 0399085B 0303440C+0303458A Combination Control Module -
 FOXBORO SY-0399095E (SY-0303451D+SY-0303460E) Process control board
 -
.jpg) FOXBORO 0399071D 0303440C+0303443B Input/Output (I/O) Module
FOXBORO 0399071D 0303440C+0303443B Input/Output (I/O) Module -
.jpg) FOXBORO RH924UQ Redundant Controller module
FOXBORO RH924UQ Redundant Controller module -
 FFOXBORO E69F-TI2-S current pneumatic converter
 -
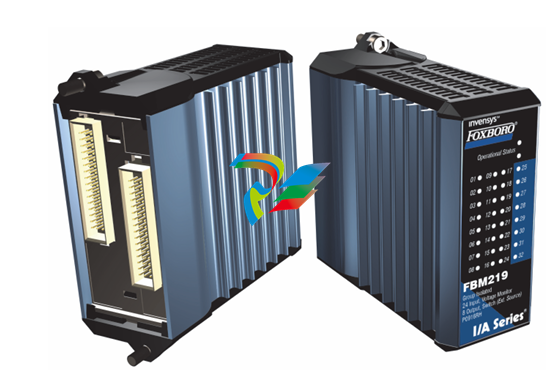 FOXBORO FBM219 RH916RH Discrete I/O Module
 -
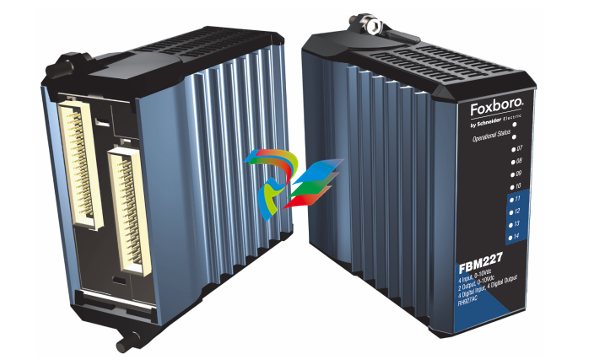 FOXBORO FBM227 P0927AC Module
 -
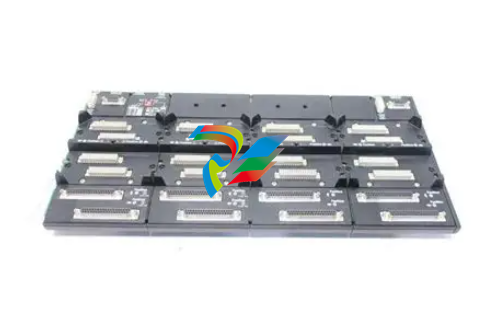
.jpg) FOXBORO 0399144 SY-0301059F SY-1025115C/SY-1025120E I/O module
FOXBORO 0399144 SY-0301059F SY-1025115C/SY-1025120E I/O module -
.jpg) FOXBORO SY-60399001R SY-60301001RB Industrial Control Module
FOXBORO SY-60399001R SY-60301001RB Industrial Control Module -
 FOXBORO 0399143 SY-0301060R SY-1025115C SY-1025120E Combined control board
 -
 FOXBORO 873EC-JIPFGZ electrodeless conductivity analyzer
 -
 FOXBORO P0916PH (High-density HART I/O Module)
 -
 FOXBORO 870ITEC-AYFNZ-7 Intelligent Electrochemical Transmitters
 -
 FOXBORO Compact FBM240. Redundant with Readback, Discrete
 -
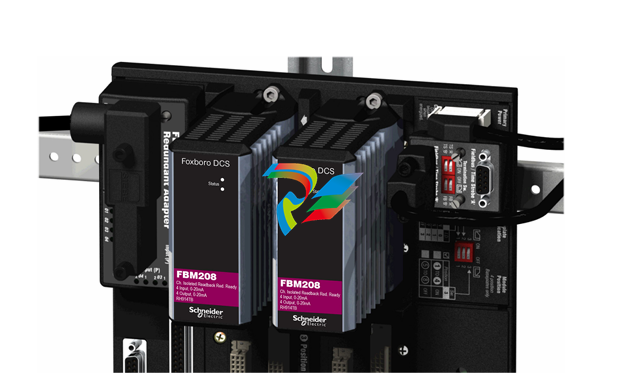 FOXBORO FBM208/b, Redundant with Readback, 0 to 20 mA I/O Module
 -
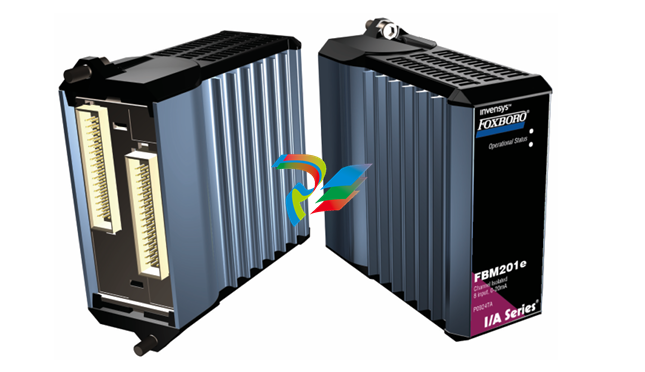 FOXBORO FBM201e Analog Input (0 to 20 mA) Interface Modules
 -
.jpg) FOXBORO P0916WG Terminal cable
FOXBORO P0916WG Terminal cable -
 FOXBORO P0926MX 2-Port Splitter
 -
.jpg) FOXBORO AD908JQ High-Frequency Module
FOXBORO AD908JQ High-Frequency Module -
.jpg) FOXBORO AD916CC Processor module
FOXBORO AD916CC Processor module -
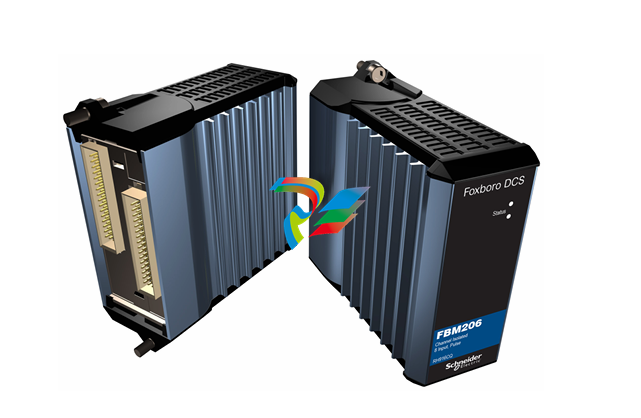 Foxboro DCS FBM206 Pulse Input Module
 -
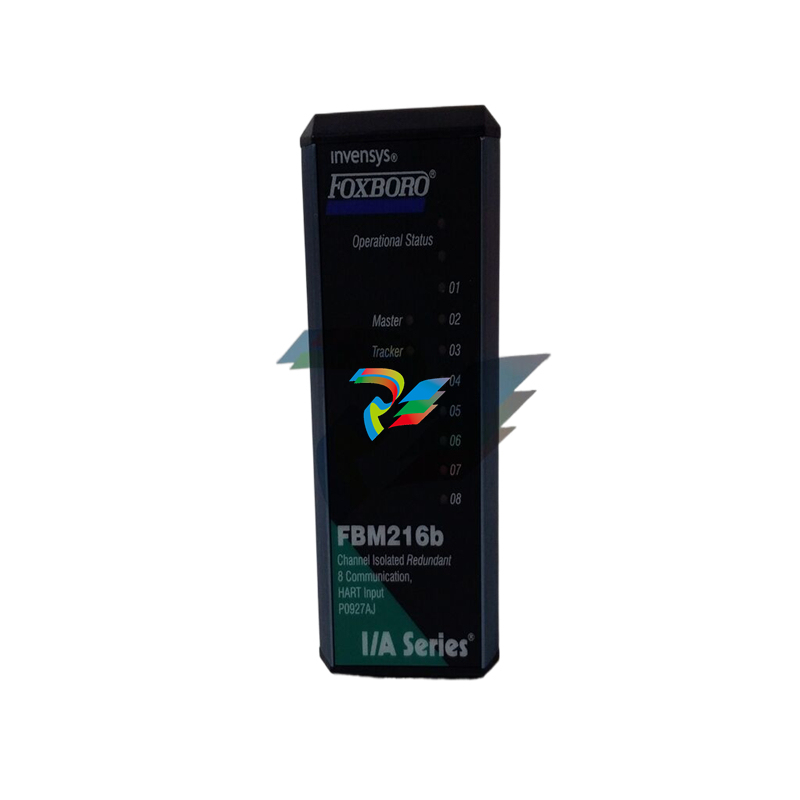
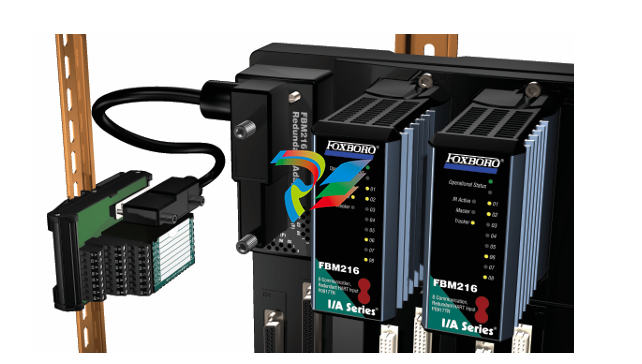 FOXBORO FBM216 HART® Communication Redundant Input Interface Module
 -
 Foxboro p0903nu 1×8 unit sub-component module
 -
 Foxboro P0911SM Industrial control module
 -
 Foxboro CM902WM I/O module
 -
 Foxboro CM902WL Power module
 -
 Foxboro P0972VA Industrial Control Module
 -
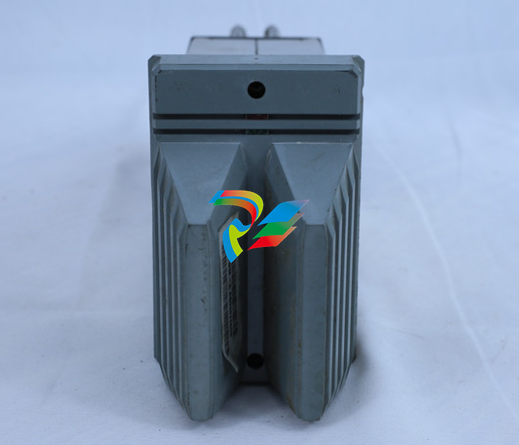
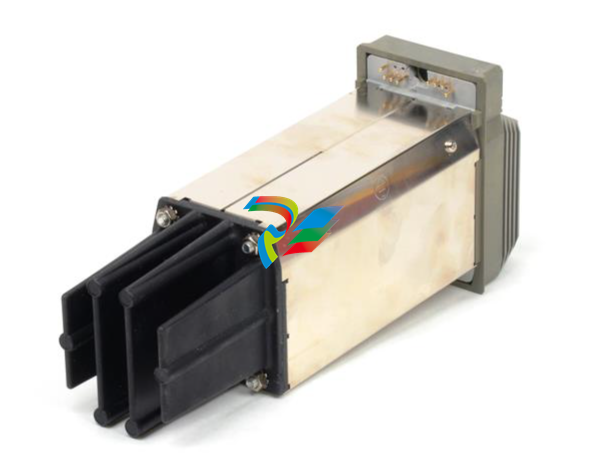
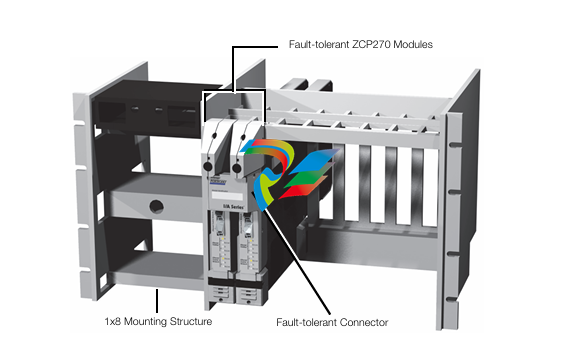
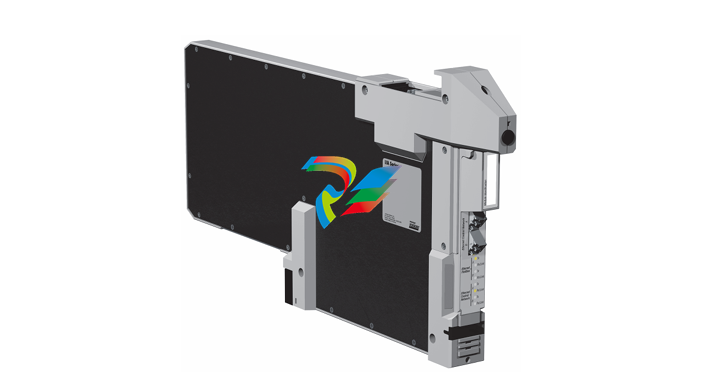 Foxboro Z-Module Control Processor 270 (ZCP270)
 -
 Foxboro PO916JS 16-channel terminal block module
 -
 Foxboro PO911SM High-performance digital/analog input/output module
 -
 Foxboro P0972PP-NCNI Network Interface Module
 -
.jpg) FOXBORO P0971QZ controller module
FOXBORO P0971QZ controller module -
 FOXBORO P0971DP Thermal resistance input/output module
 -
 FOXBORO P0970VB Cable connector
 -
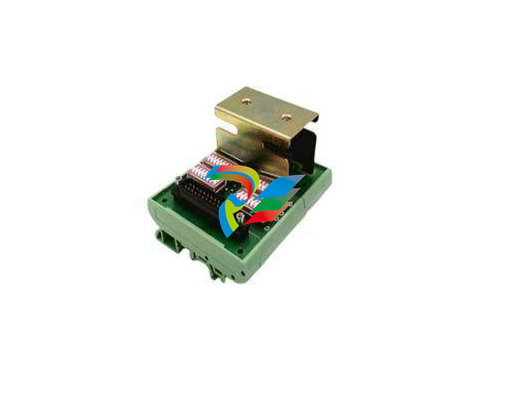
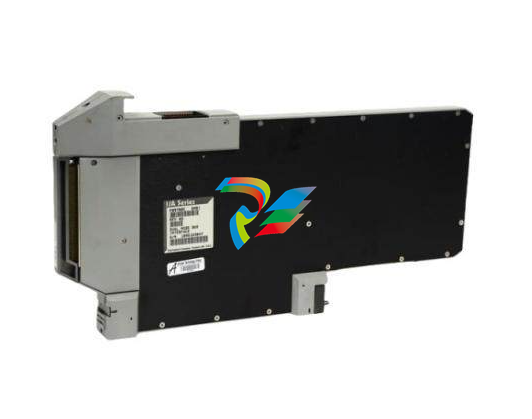
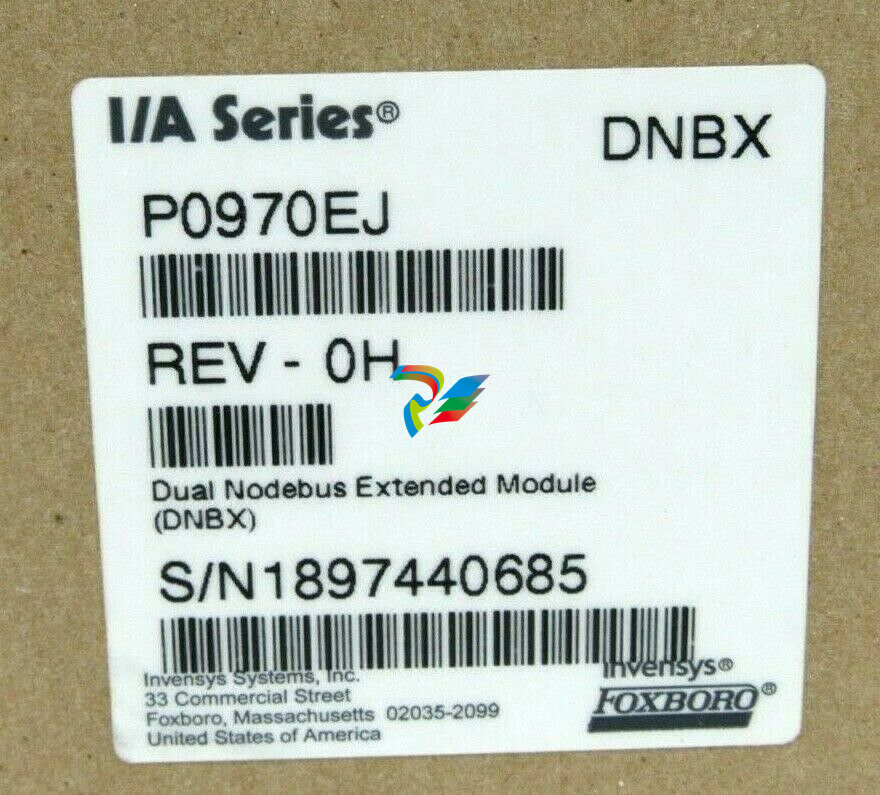 FOXBORO P0970EJ-DNBX Dual-node bus expansion module
 -
 FOXBORO P0970BP Redundant power supply system
 -
.jpg) FOXBORO P0970BC-DNBI DeviceNet bus interface module
FOXBORO P0970BC-DNBI DeviceNet bus interface module -
.jpg) FOXBORO P0961FX-CP60S Main control CPU module
FOXBORO P0961FX-CP60S Main control CPU module -
.jpg) FOXBORO P0961EF-CP30B Network Interface Unit
FOXBORO P0961EF-CP30B Network Interface Unit -
.jpg) FOXBORO P0961CA Optical fiber local area network module
FOXBORO P0961CA Optical fiber local area network module -
.jpg) FOXBORO P0961BD-GW30B gateway processor module
FOXBORO P0961BD-GW30B gateway processor module -
.jpg) FOXBORO P0961BC-CP40B/I/A Series high-performance control processor module
FOXBORO P0961BC-CP40B/I/A Series high-performance control processor module -
FOXBORO P0960JA-CP40 High-performance control processor
-
FOXBORO P0926TM Control module
-
 FOXBORO P0916BX Termination Assembly
 -
.jpg) FOXBORO P0916AE P0916AG P0916AW Thermal resistance input type DCS card module
FOXBORO P0916AE P0916AG P0916AW Thermal resistance input type DCS card module -
 FOXBORO P0916AC FOXBORO distributed control system (DCS) compression terminal assembly
 -
.jpg) FOXBORO P0912CB High-performance interface module
FOXBORO P0912CB High-performance interface module -
.jpg) FOXBORO P0911VJ Thermal resistance input output module
FOXBORO P0911VJ Thermal resistance input output module -
.jpg) FOXBORO P0911QH-A High-precision module
FOXBORO P0911QH-A High-precision module -
 FOXBORO P0911QB-C P0911QC-C Thermal resistance input/output module
 -
 FOXBORO P0904BH P0904FH P0904HB Distributed Control system (DCS) module
 -
 FOXBORO P0903ZP P0903ZQ Embedded System Debugging Module
 -
 Foxboro P0903ZL P0903ZN Industrial power module
 -
 Foxboro P0903ZE I/A Series Fieldbus Isolator Module
 -
 FOXBORO P0903NW Industrial Control Module
 -
.jpg) FFOXBORO P0903NQ Industrial power module
FFOXBORO P0903NQ Industrial power module -
 FFOXBORO P0903AA Control Module
 -
 FOXBORO P0400DL Digital output module
 -
.jpg) FOXBORO P0400BJ Digital output module
FOXBORO P0400BJ Digital output module -
 FOXBORO GW30 industrial control module
 -
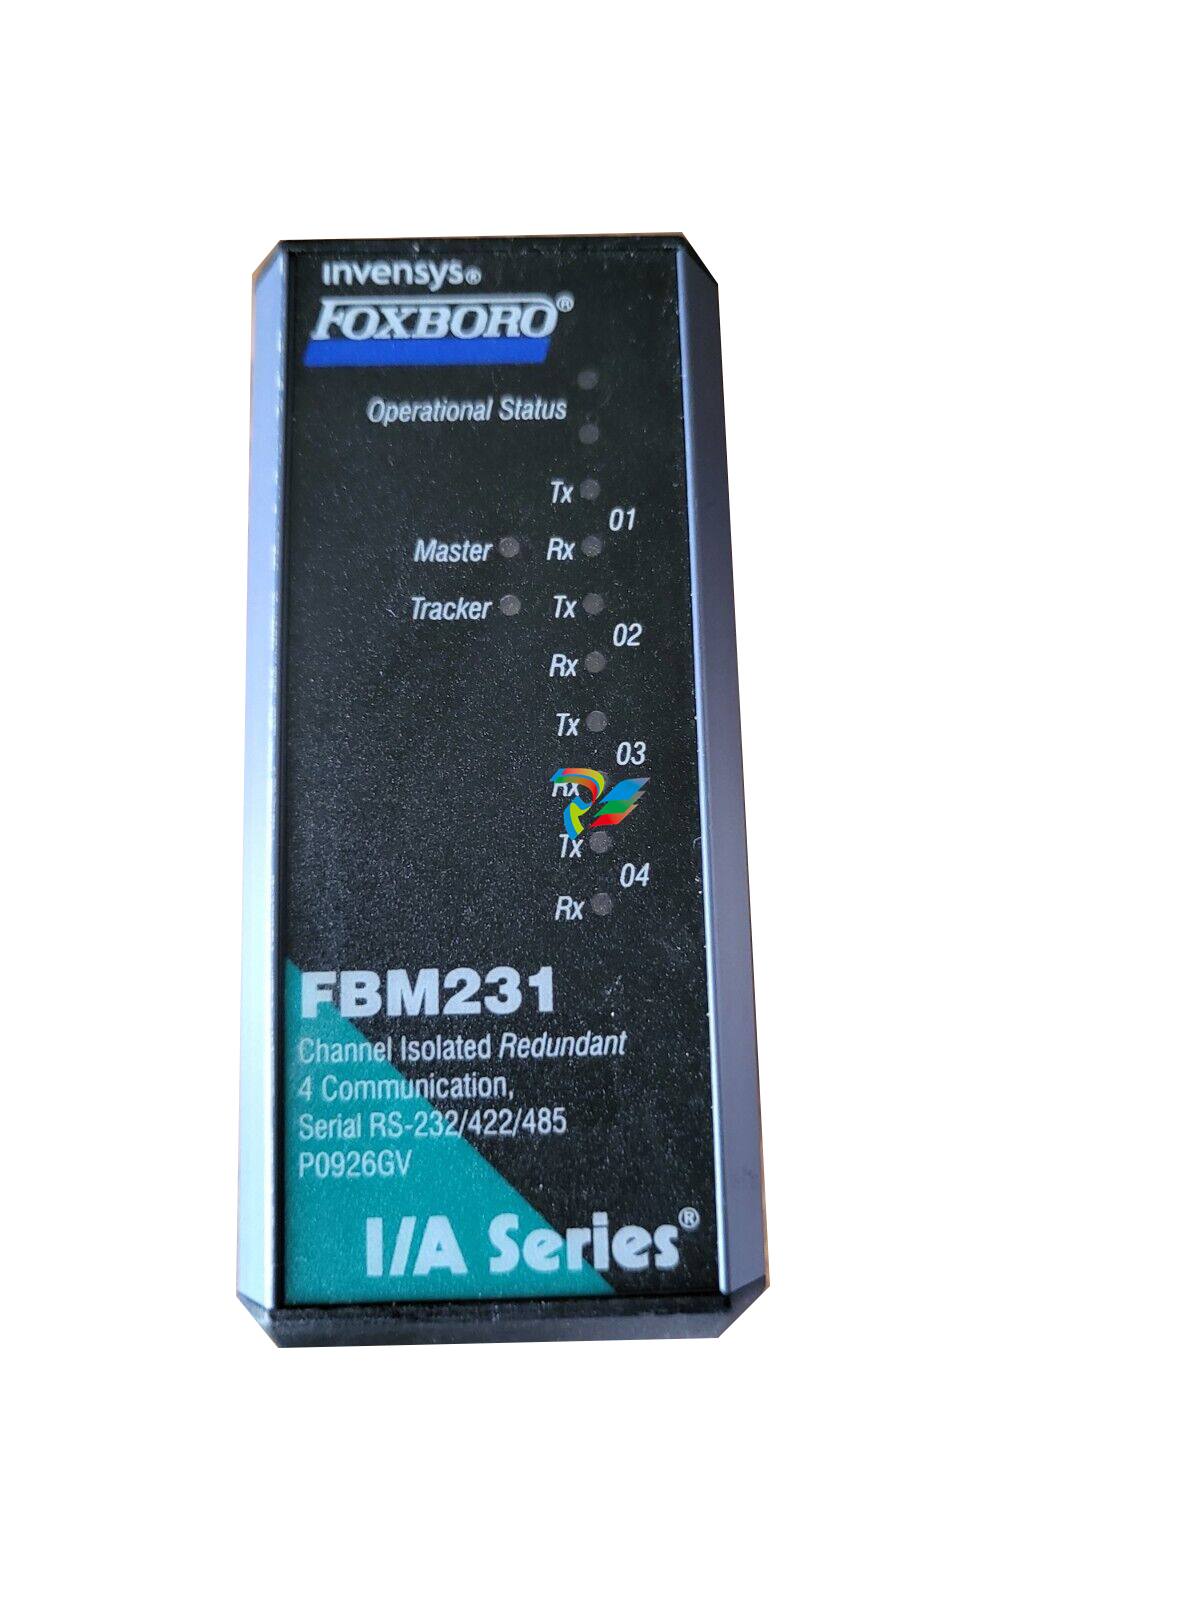 FOXBORO FBM231 Communication Output Module
 -
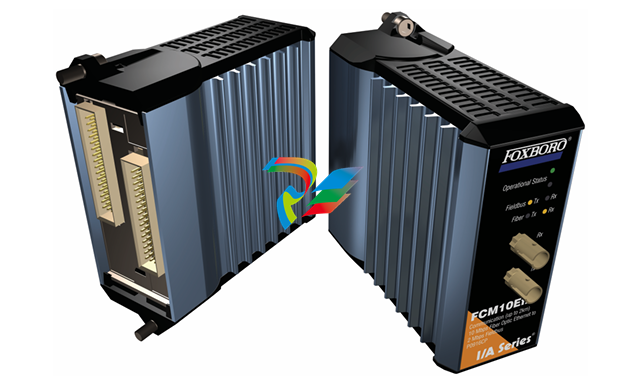 FOXBORO Fieldbus Communications Module, FCM10Ef
 -
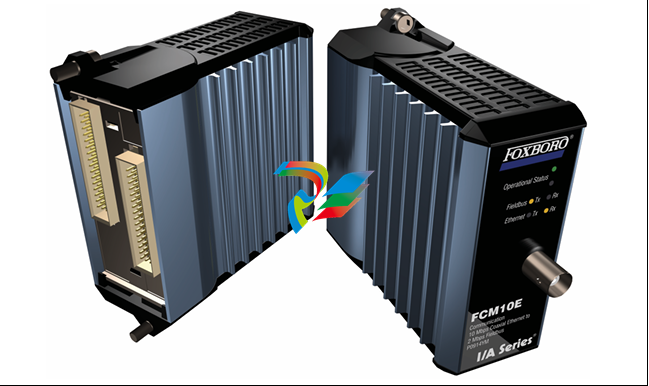 FOXBORO Fieldbus Communications Module, FCM10E