
Using Control Valve Installed Gain Calculations
With the 17-hp pump, besides requiring a more expensive 6-inch valve, the gain graph looks terrible. The installed gain is the highest of the three (meaning a larger flow error for the same valve position error), it drops to 0.4 as it approaches the maximum design flow (the red vertical line at 1.0 on the Q/Qmax scale), and the variation in gain over the flow range is almost 7:1, much greater than the recommendation of 2:1. This is large enough that it would be difficult to come up with proportional-integral-derivative (PID) tuning parameters that would provide good and stable control over the entire required flow range. The gain graphs of the 23-hp and 29-hp pumps fall within the recommended gain criteria, but the 23-hp pump is the winner, because its gain is closer to 1.0, and it also is the more economical of the two to operate.
References
1. Monsen, Jon, Rules of Thumb, Flow Control, November 2012 pp. 24–26
2. Monsen, Jon, An Insider’s Guide to Installed Gain as a Control Valve Sizing Criterion, Flow Control, May 2015, pp. 22-25.
3. Monsen, Jon, Modern Tools for Sizing Control Valves & Actuators, Processing, January 2018 pp. 12-14
4. Monsen, Jon, Calculating the Installed Flow and Gain of a Control Valve, Process Instrumentation, March 2021, pp. 26–30. (The worksheet described in the reference and an enhanced version are available.)
5. Jessee, Peter, Determining Pressure Drop for Control Valve Sizing, Flow Control, August 2000, pp. 12-14.
6. Coggan, D. A, ed., “Fundamentals of Industrial Control,” Second Edition, Research Triangle Park, NC: Instrumentation, Systems, and Automation Society (ISA) (now the International Society of Automation—ISA), 2004. pp. 278–280.
This article was originally published in the December 2021 issue of InTech magazine.
-
 IS200BPPBH2CAA Mark VIe Power Supply Module
 -
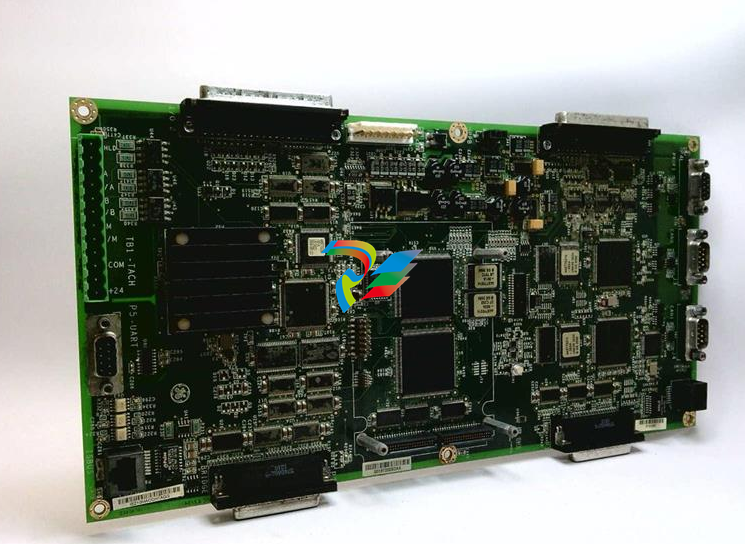
 IS210MACCH2AEG Motor Control and Communication Module
 -
 IS210MACCH2AGG Mark VIe Speedtronic Turbine Control Module
 -
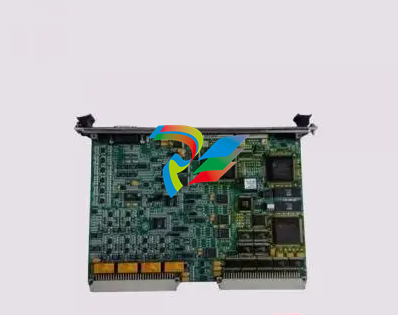
 IS200AEPAH1AFD Printed circuit board
 -
IS200AEPAH1ACB Analog I/O Module
-
 IS200WREAS1ADB AERO TRIP TB DBRD sub-board
 -
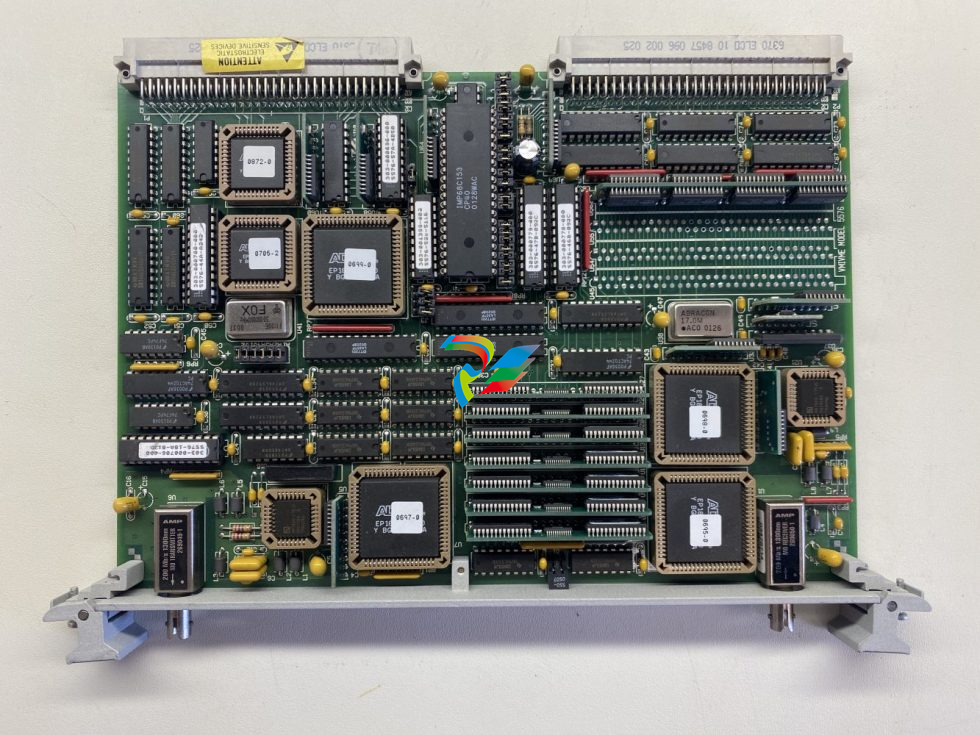
 IS200WETAH1AEC large board component made Mark VI system
 -
 IS200AEPAH1AHD A High-Precision Excitation Control Board for Turbine Systems
 -
 IS200WEMAH1AEA Control board
 -
 IS210MACCH1AGG processor card
 -
 IS230TNRLH1B Discrete Output Modular Assembly
 -
 Mark V Series DS200PCCAG1ACB PCB Power Connect Card
 -
 DS200SI0CG1AEA Instantaneous overcurrent card
 -
 DS200SHVMG1AGE Analog I/O board
 -
 DS200SI0CG1A6A Input/Output Module
 -
 DS200SHVMG1AFE SCR High Voltage Interface Board
 -
 DS200RT8AG3AHC Relay Output Terminal Board
 -
 DS200FSAAG1ABA PCB Field Supply Gate Amplifier Board
 -
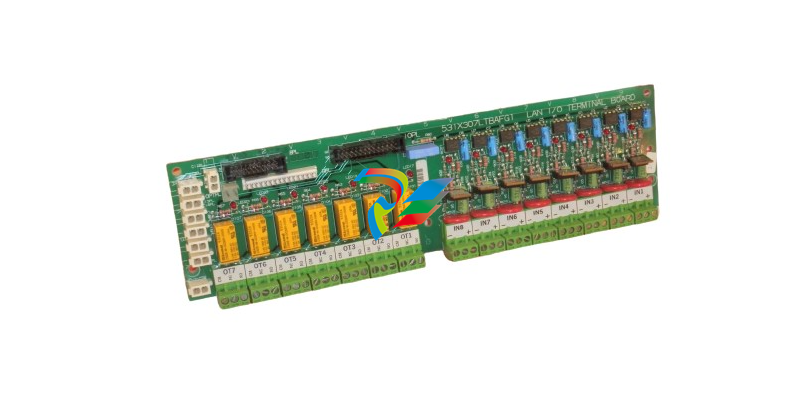 531X307LTBAFG1 F31X307LTBA LAN I/O Terminal Board
 -
 ABB AFS670 19" Ruggedized Switch AFS670-EREEDDDSSEEEEEEEPZYX05.1.0
 -
 NI Controller for VXI VXIPC-871B
 -
 IS200EPMCH1GE Mark VIe Patch Cord Power Distribution Card
 -
 VMICPCI-7632-03310 IS215UCCAH3A 350-657362-003310J GE gas turbine system control processor board
 -
 WEA13-13 2508-21001 Control Module / I/O Board
 -
.jpg) WES5120 2340-21004 Controller Main Module
WES5120 2340-21004 Controller Main Module -
 WES5120 2340-21006 Field Controller Master Unit Module
 -
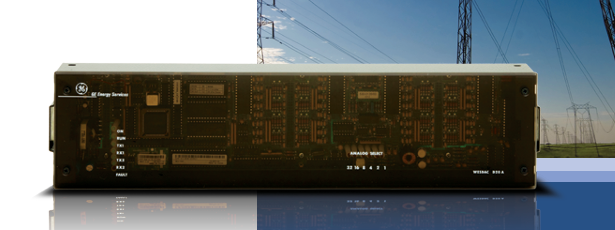
WESDAC D20ME 18-MAR-13 Excitation Control Module
-
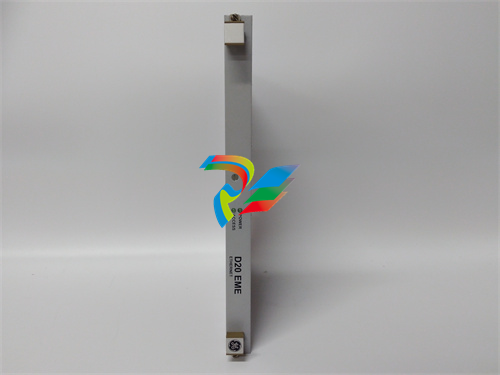 D20 EME 2400-21004 Ethernet communication and expansion module
 -
 GE DS3800XTFP1E1C Thyristor Fan Out Board Brand
 -
 GE SR745-W2-P1-G1-HI-A-L-R-E Feeder protection relay
 -
 GE IS230TNDSH2A Discrete Output Relay Module Brand
 -
 GE Fanuc IS200TDBSH2ACC Mark VI Terminal Board Brand
 -
 GE PMC-0247RC-282000 350-93750247-282000F Disk Drive
 -
GE PMC-0247RC-282000 350-93750247-282000F Disk Drive
-
 GE VMIVME-1150 Serial Communications Controller
 -
 GE VMIVME-5576 Fiber-Optic Reflective Memory with Interrupts
 -
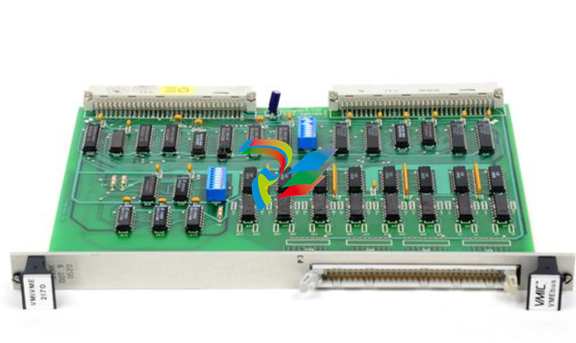 GE VMIC Isolated Digital Output VMIVME-2170A
 -
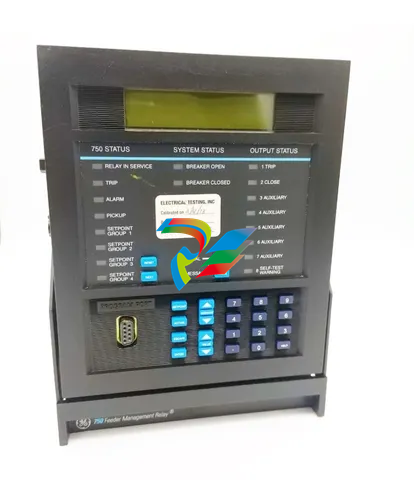 GE MULTILIN 760 FEEDER MANAGEMENT RELAY 760-P5-G5-S5-HI-A20-R-E
 -
 GE IS200AEPAH1BKE IS215WEPAH2BB Printed circuit board
 -
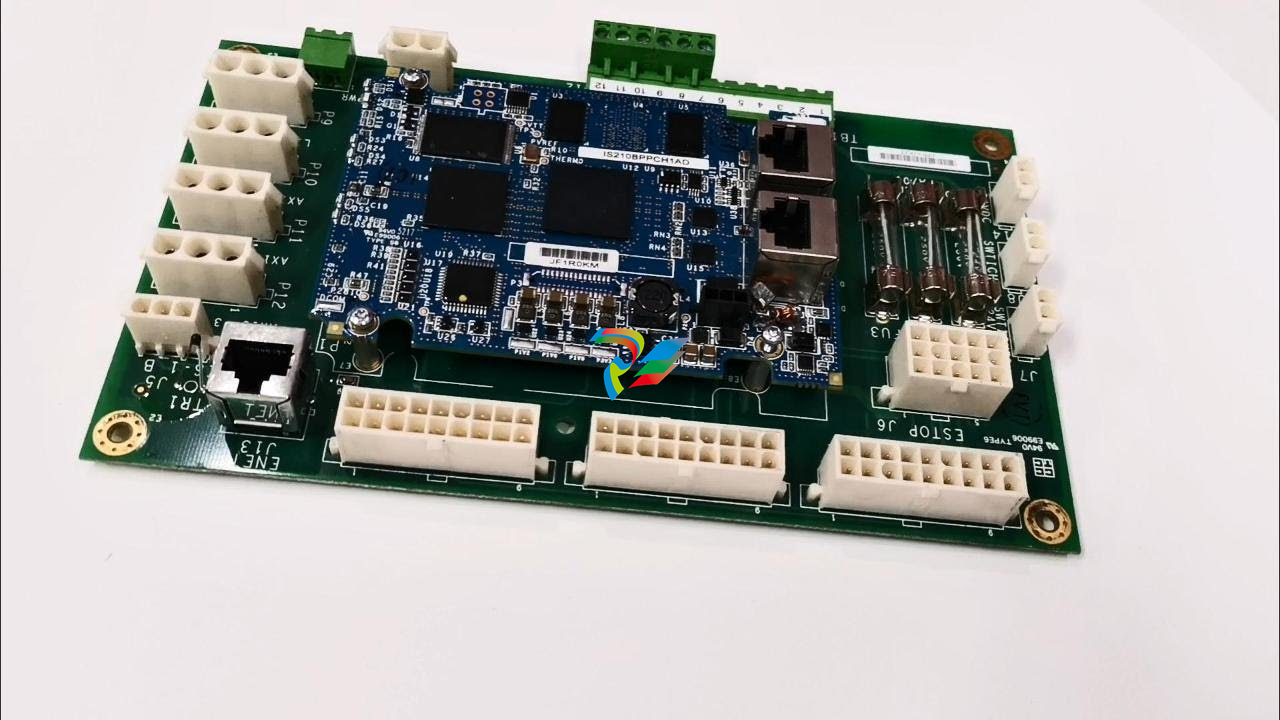 GE IS210BPPCH1A Mark VIe I/O Pack Processor Card
 -
 GE IS220PRTDH1A 336A4940CSP6 High-Performance RTD Input Module
 -
GE IS220PDIAH1BE 336A5026ADP4 Discrete Input Module
-
 GE IS420ESWBH3A IONET Switch Module
 -
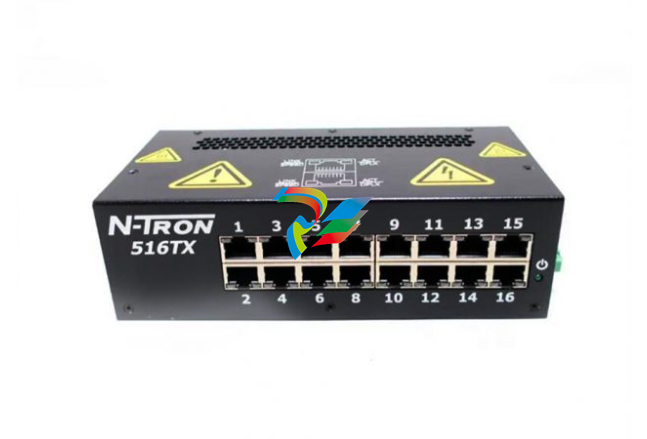 GE 516TX 336A4940DNP516TX 16-port Ethernet switch
 -
 GE EVMECNTM13 Embedded control module
 -
GE EVPBDP0001 EVPBDP032 control module
-
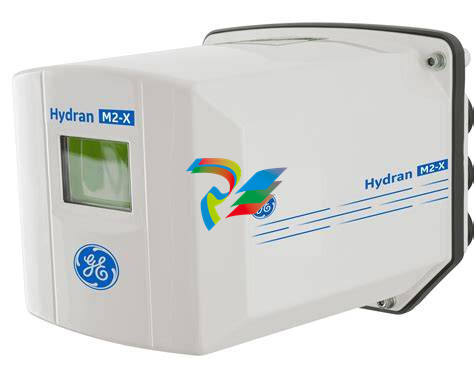 GE Hydran M2-X Enhanced Monitoring with Extended Sensor Life
 -
 GE UR6CH Digital I/O Module
 -
 GE IC695CPU315-CD Central processing unit
 -
 GE 531X305NTBAMG1 DR Terminal Board
 -
 GE 531X305NTBALG1 NTB/3TB Terminal Board 531X Series
 -
 GE 531X305NTBAJG1 NTB/3TB Terminal Board.
 -
GE 531X305NTBAHG1 NTB/3TB Terminal Board 531X
-
 GE 531X305NTBAEG1 is a PCB that functions as a DR terminal board.
 -
General Electric 531X305NTBACG1 NTB/3TB Terminal Board 531X
-
 GE Digital Energy D20 Analog Input Module
 -
 GE 94-164136-001 main board Control board
 -
 GE 269 PLUS-D/O-100P-125V Digital motor relay
 -
 GALIL DMC-9940 High-performance motion controller
 -
FUJI NP1BS-08 base plate
-
 FUJI NP1Y32T09P1 Transistor drain type digital output module
 -
 FUJI NP1Y16R-08 Digital Output Module
 -
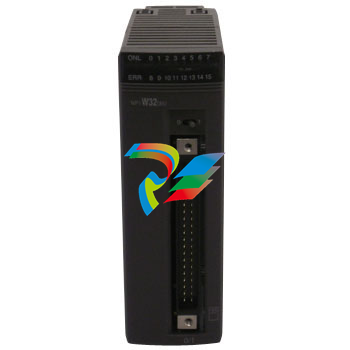
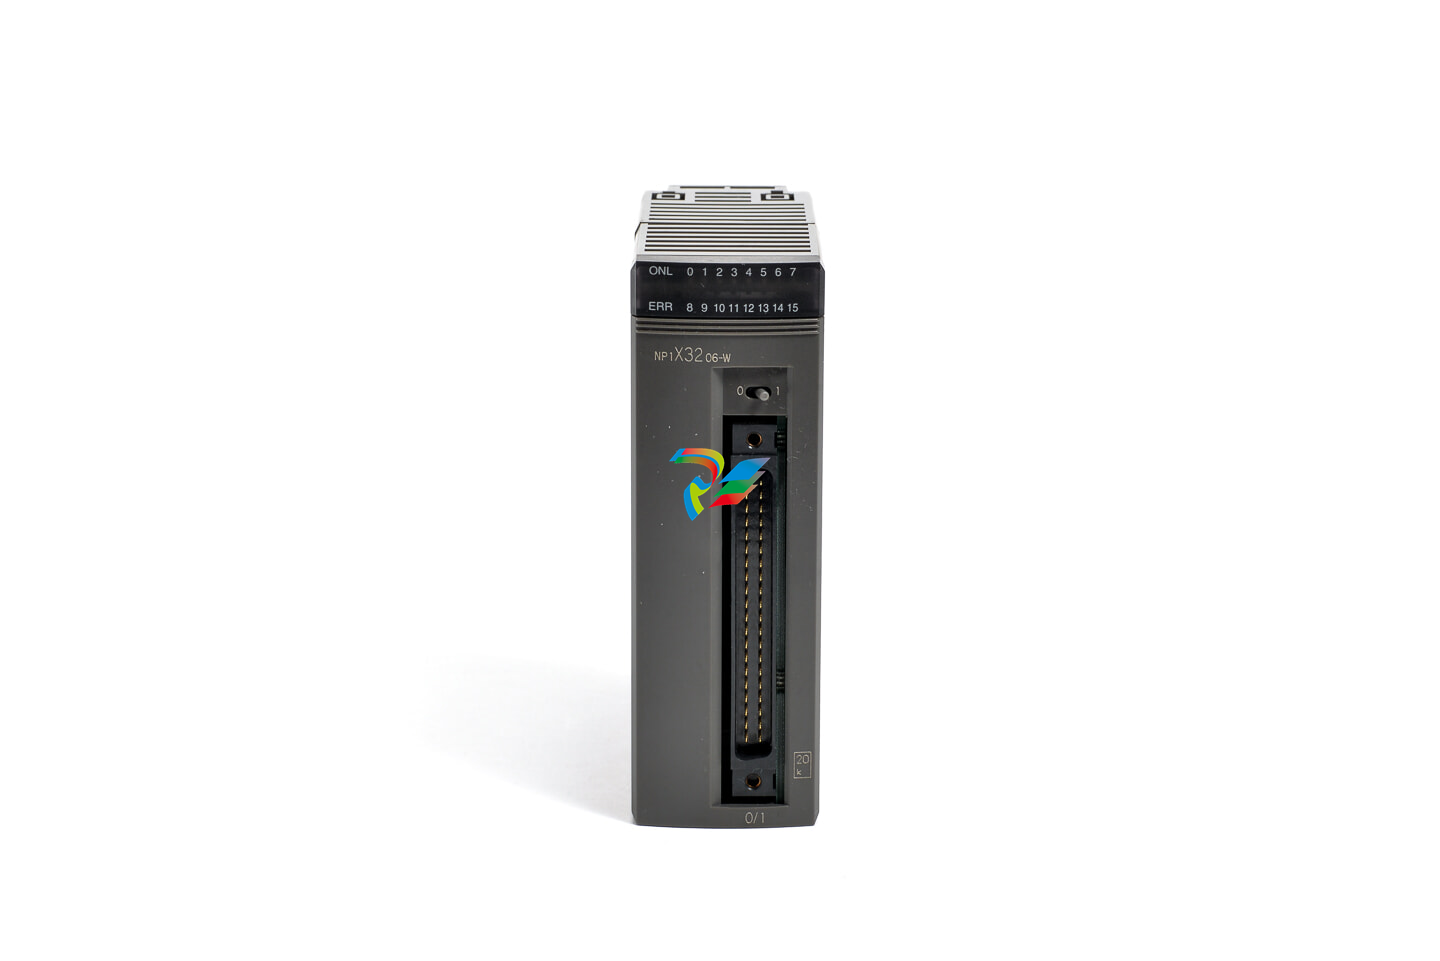 FUJI NP1X3206-A High-speed digital input module
 -
 FUJI NP1AYH4I-MR current output module
 -
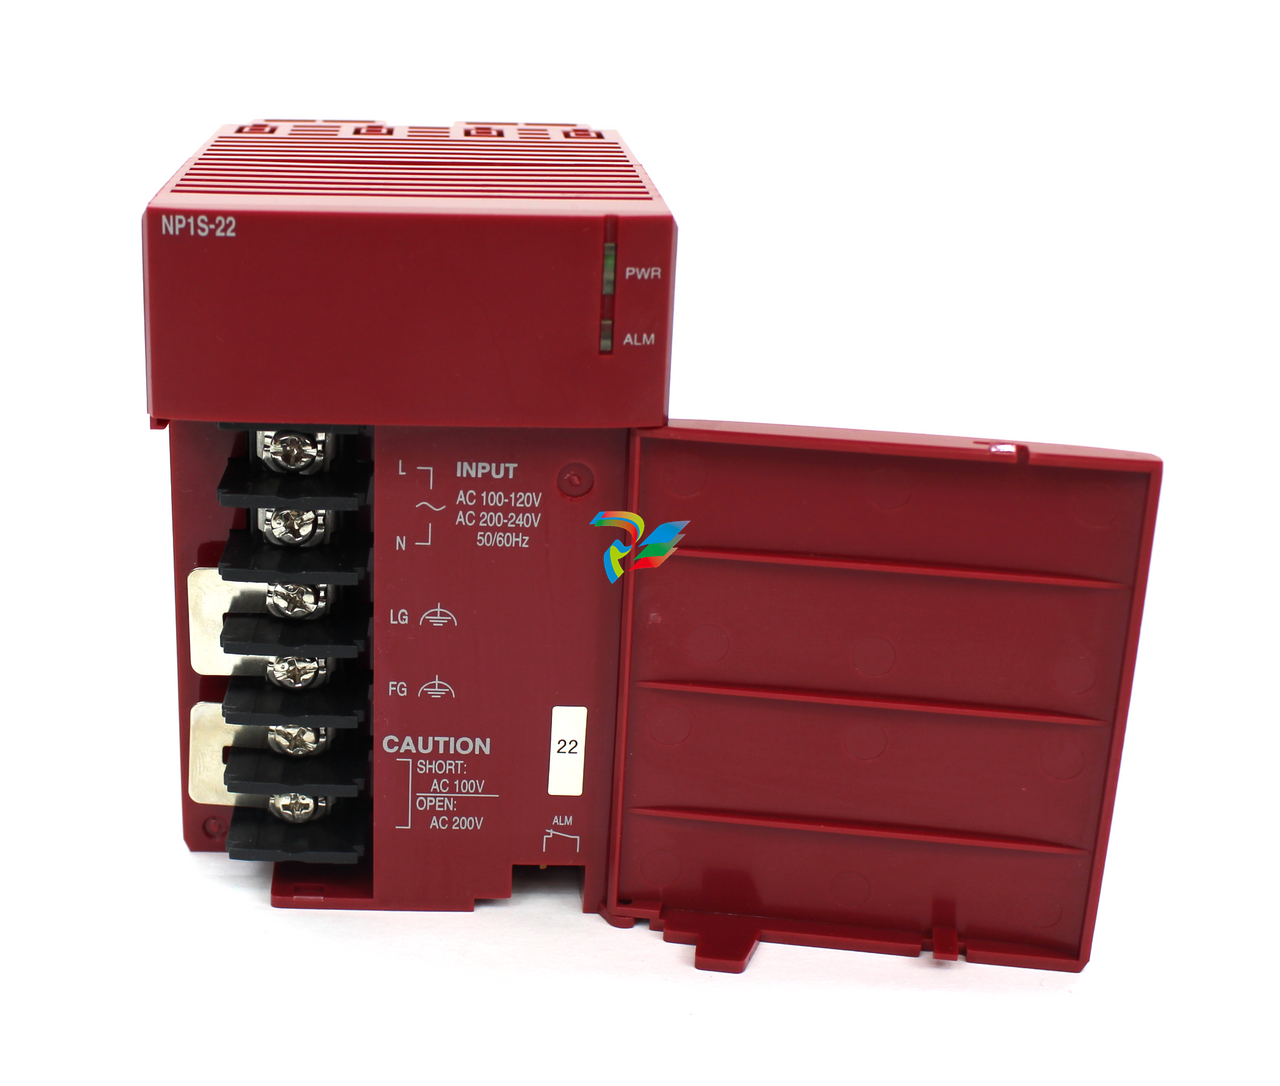 FUJI NP1S-22 Power module redundancy
 -
 FUJI RPXD2150-1T servo drive module
 -
 FUJI FVR008E7S-2UX Ac frequency converter
 -
 FUJI Ac frequency converter FVR008E7S-2
 -
 FUJI FVR004G5B-2 Small general-purpose frequency converter
 -
 FUJI A50L-2001-0232 Industrial control module
 -
 FUJI A50L-001-0266#N High-performance servo amplifier
 -
 Honeywell FS7-2173-2RP Gas sensor
 -
 Honeywell 10106/2/1 Digital Input Module in Stock
 -
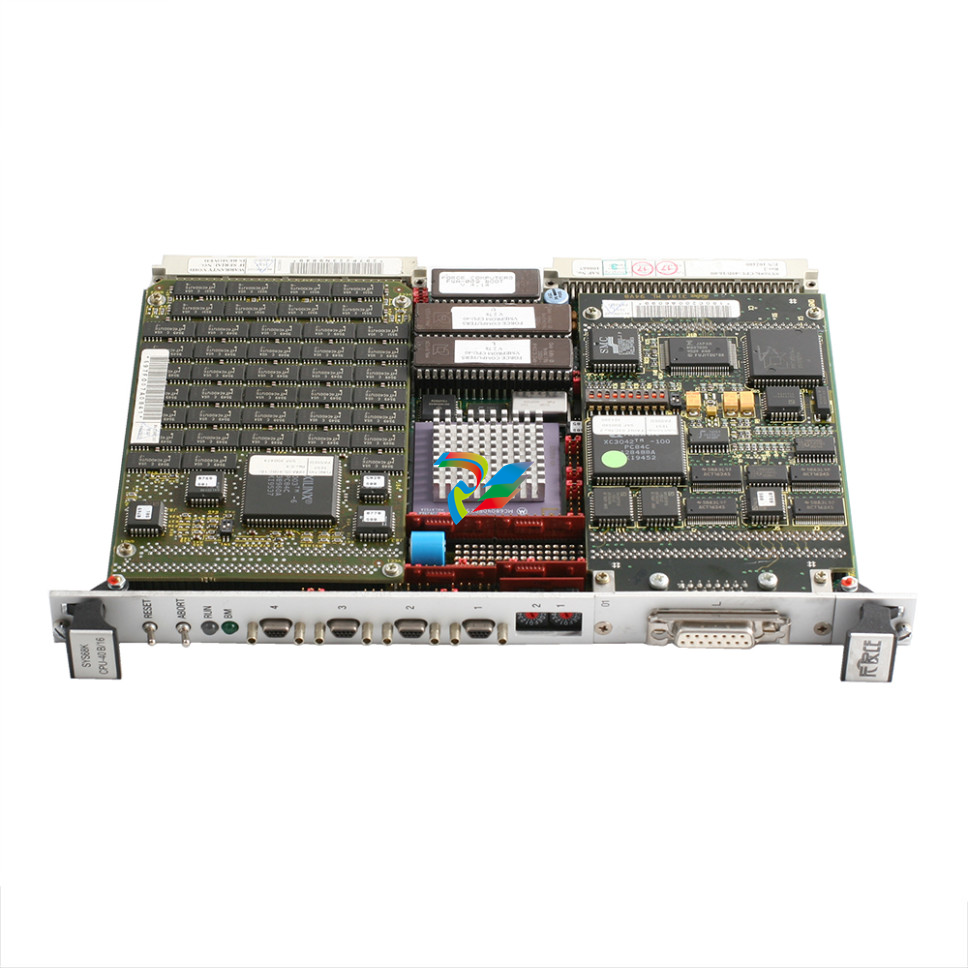
FRCE SYS68K CPU-40 B/16 PLC core processor module
-
 Foxboro FBM I/O cards PBCO-D8-009
 -
 Foxboro AD916AE Digital Control System (DCS) Module
 -
 GE SR750-P5-G5-S5-HI-A20-R-E Multilin Relay
 -
.jpg) FOXBORO H90 H90C9AA0117S Industrial Computer Workstation
FOXBORO H90 H90C9AA0117S Industrial Computer Workstation -
FOXBORO RH928AW | I/A Series Relay Output Module
-
.jpg) Foxboro N-2AX+DIO Multi-functional input/output module
Foxboro N-2AX+DIO Multi-functional input/output module -
 Foxboro RH924WA FCP280 Fiber Optic Network Adapter
 -
 FOXBORO H92 Versatile Hardware Component In
 -
 Foxboro FBM218 P0922VW HART® Communication Redundant Output Interface Module
 -
 Foxboro E69F-TI2-J-R-S E69F Series Current-To-Pneumatic Signal Converter
 -
 Foxboro E69F-BI2-S Converter
 -
.jpg) Foxboro H92A049E0700 The host of the DCS control station
Foxboro H92A049E0700 The host of the DCS control station -
 Foxboro H90C9AA0117S Industrial computer workstation
 -
 Foxboro RH101AA High-performance industrial control module
 -
 Foxboro P0922YU FPS400-24 I/A Series Power supply
 -
.png) FOXBORO P0973LN Chassis-based managed switch with independent power supply
FOXBORO P0973LN Chassis-based managed switch with independent power supply -
.jpg) FOXBORO P0926PA Input/output module
FOXBORO P0926PA Input/output module -
 Fanuc A06B-6050-H402 3 AXIS ANALOG AC SERVO DRIVE
 -
.jpg) FOXBORO L0130AD L0130AE-0H Power module group
FOXBORO L0130AD L0130AE-0H Power module group -
_lVjBYb.jpg) FOXBORO 0399085B 0303440C+0303458A Combination Control Module
FOXBORO 0399085B 0303440C+0303458A Combination Control Module -
 FOXBORO SY-0399095E (SY-0303451D+SY-0303460E) Process control board
 -
.jpg) FOXBORO 0399071D 0303440C+0303443B Input/Output (I/O) Module
FOXBORO 0399071D 0303440C+0303443B Input/Output (I/O) Module -
.jpg) FOXBORO RH924UQ Redundant Controller module
FOXBORO RH924UQ Redundant Controller module -
 FFOXBORO E69F-TI2-S current pneumatic converter
 -
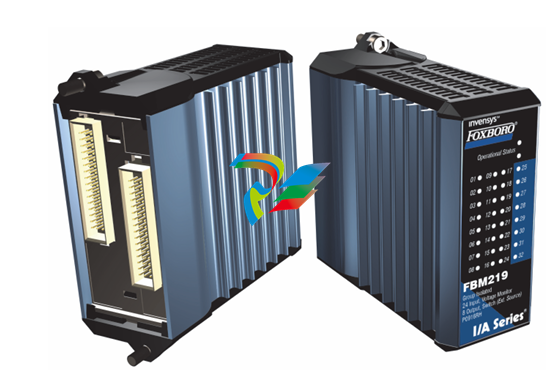 FOXBORO FBM219 RH916RH Discrete I/O Module
 -
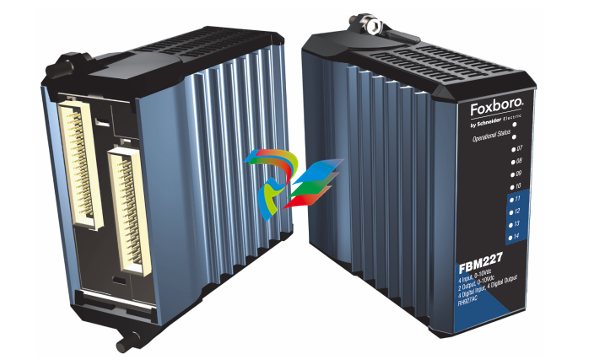 FOXBORO FBM227 P0927AC Module
 -
.jpg) FOXBORO 0399144 SY-0301059F SY-1025115C/SY-1025120E I/O module
FOXBORO 0399144 SY-0301059F SY-1025115C/SY-1025120E I/O module -
.jpg) FOXBORO SY-60399001R SY-60301001RB Industrial Control Module
FOXBORO SY-60399001R SY-60301001RB Industrial Control Module -
 FOXBORO 0399143 SY-0301060R SY-1025115C SY-1025120E Combined control board
 -
 FOXBORO 873EC-JIPFGZ electrodeless conductivity analyzer
 -
 FOXBORO P0916PH (High-density HART I/O Module)
 -
 FOXBORO 870ITEC-AYFNZ-7 Intelligent Electrochemical Transmitters
 -
 FOXBORO Compact FBM240. Redundant with Readback, Discrete
 -
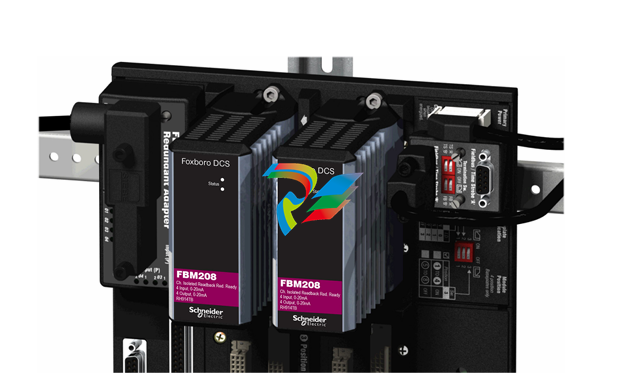 FOXBORO FBM208/b, Redundant with Readback, 0 to 20 mA I/O Module
 -
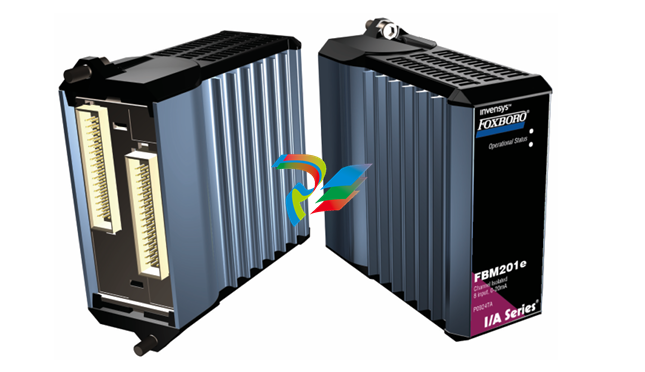 FOXBORO FBM201e Analog Input (0 to 20 mA) Interface Modules
 -
.jpg) FOXBORO P0916WG Terminal cable
FOXBORO P0916WG Terminal cable -
 FOXBORO P0926MX 2-Port Splitter
 -
.jpg) FOXBORO AD908JQ High-Frequency Module
FOXBORO AD908JQ High-Frequency Module -
.jpg) FOXBORO AD916CC Processor module
FOXBORO AD916CC Processor module -
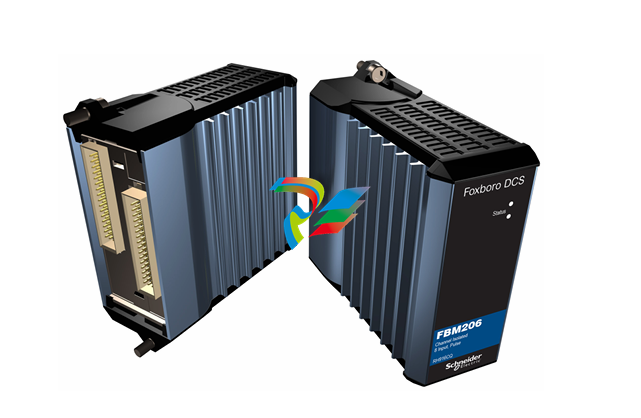 Foxboro DCS FBM206 Pulse Input Module
 -
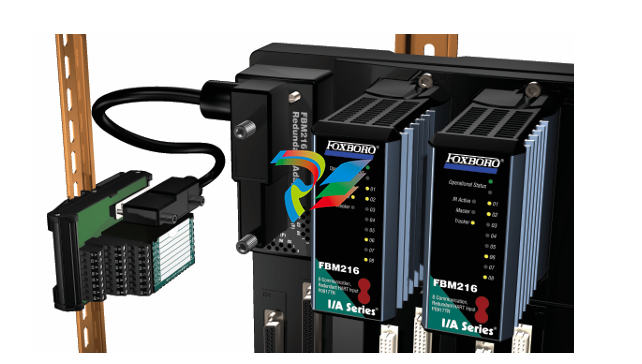 FOXBORO FBM216 HART® Communication Redundant Input Interface Module
 -
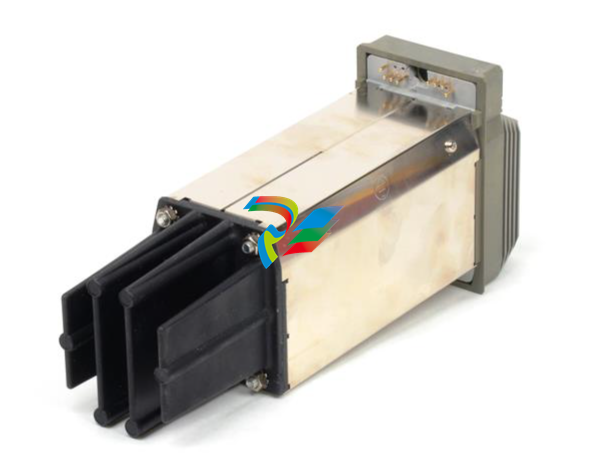
 Foxboro p0903nu 1×8 unit sub-component module
 -
 Foxboro P0911SM Industrial control module
 -
 Foxboro CM902WM I/O module
 -
 Foxboro CM902WL Power module
 -
 Foxboro P0972VA Industrial Control Module
 -
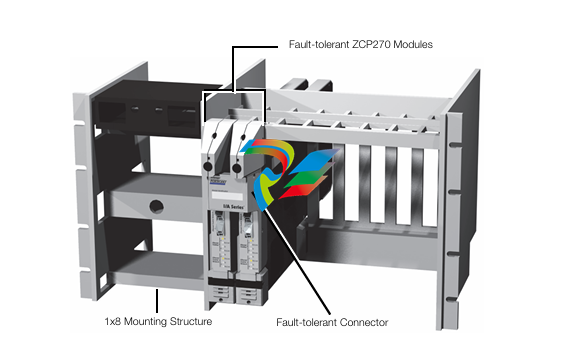
 Foxboro Z-Module Control Processor 270 (ZCP270)
 -
 Foxboro PO916JS 16-channel terminal block module
 -
 Foxboro PO911SM High-performance digital/analog input/output module
 -
 Foxboro P0972PP-NCNI Network Interface Module
 -
.jpg) FOXBORO P0971QZ controller module
FOXBORO P0971QZ controller module -
 FOXBORO P0971DP Thermal resistance input/output module
 -
 FOXBORO P0970VB Cable connector
 -
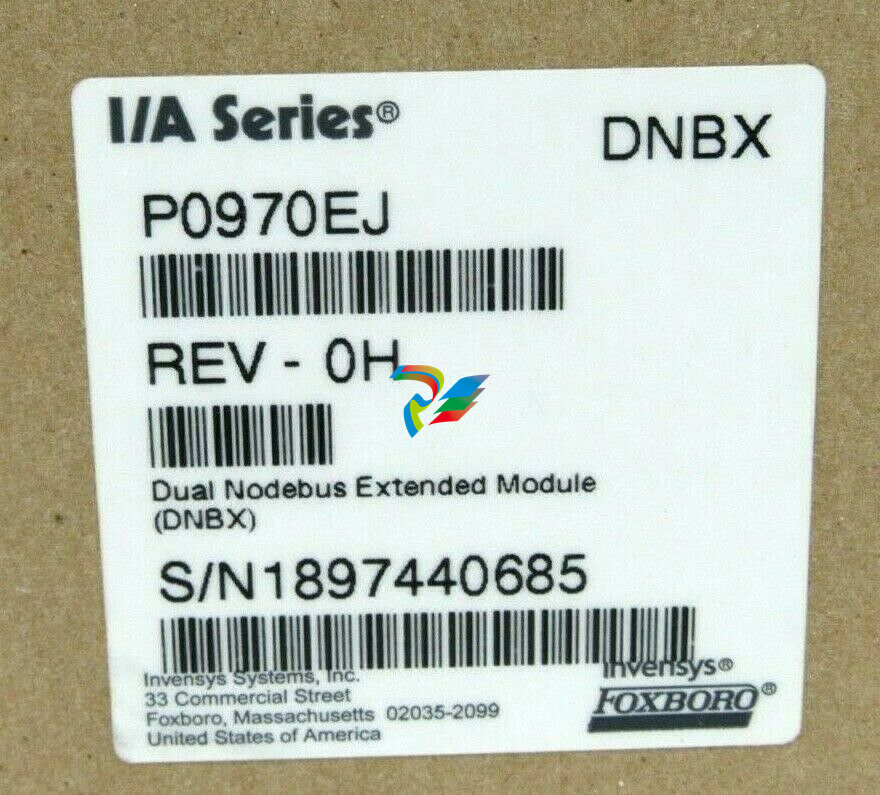 FOXBORO P0970EJ-DNBX Dual-node bus expansion module