
Using Control Valve Installed Gain Calculations

Reference 4 does not include the ability to graph what is happening to P1 and P2, and thus the pressure differential available to the valve. However, the reference 4 worksheet has a tabulation of P1 and P2, so constructing a graph of P1 and P2 versus relative valve travel was simple. In the installed pressure level graph, as valve relative travel approaches 0.8 (80% valve travel), the pressure drop available to the valve decreases rapidly.
Different pump, different valves
The user found a pump with a slightly higher and flatter head curve. A new analysis of the upstream system gave the revised values of P1 and DELTA P shown in red in Figure 4. Putting these new values of P1 and DELTA P into the user’s valve-sizing program and into the reference 4 worksheet gives the graphs of Figure 4. The valve is now operating between 25% and 75% travel. The maximum design flow is now at slightly less than 80% of the fully open flow, giving ample safety factor at the high end of the range. The installed gain graph is much flatter and well within the suggested limits.

Figure 5 is based on an application where the system designer recommended a 10-inch segment ball valve after examining the installed flow and gain graphs and determining the segment valve was a good choice. The purchasing agent commented that a 10-inch high-performance butterfly valve would cost approximately one-third less than the segment ball valve. The system designer agreed to investigate the applicability of a high-performance butterfly valve, knowing the two valve styles have quite different inherent flow characteristics. Segment ball valves tend to have a nearly perfect equal percentage characteristic. High-performance butterfly valves tend to have an inherent flow characteristic between linear and equal percentage.

The upper right graph in Figure 5 compares the inherent flow characteristics of the two valves being considered. The installed characteristics are linear between the design minimum and maximum flows. The installed gain of each valve meets the suggested gain limits between the minimum and maximum design flows. The gain of the segment valve is slightly closer to 1.0. The maximum gain change of the butterfly valve is 1.4:1, where the maximum gain change of the segment valve is 1.6:1. In this system, either valve would likely control satisfactorily. In a system with different valve pressure drop versus flow characteristics, this might not be the case.
Which pressure drop?
A question arose regarding the pressure drop to use when sizing a control valve. Assuming a system that has already been designed, the sizing pressure cannot be arbitrarily assigned, but the values of P1 and P2 need to be obtained by an analysis of the frictional pressure losses and static pressure changes in the system both upstream and downstream of the control valve. The ideal situation is where the person selecting the control valve has a say in determining what the control valve pressure drop will be, most often by specifying the pump that will be used. Using an installed gain analysis of various pumps that might be suitable can be helpful.
To demonstrate how this can be done, three possible pumps for the system shown in Figure 6 will be considered, and the one that allows satisfactory controllability while minimizing energy consumption will be selected. Curves of P1, the pressure just upstream of the valve, are shown for each of the three pumps, along with the power required by each at a normal flow rate of 400 gpm. These curves slope downward in proportion to the flow squared from the 100 gpm pump head (45, 60, and 75 psig, respectively, for pumps A, B, and C) to a pressure 10 psi lower due to the combined effect of the 5 psi pressure loss in the upstream piping and the 5 psi decrease in pump head from 100 gpm to 600 gpm stated in the figure. The curve for P2, the pressure at the control valve outlet, starts with the 10 psig static head of the tank at very low flows and increases in proportion to the flow squared to 30 psig as the downstream piping and heat exchanger pressure losses increase to their 600 gpm values.

The control valve pressure drops (the difference between P1 and P2) are indicated in the figure by the arrows at the left side of the figure for 100 gpm and at the right side of the figure for 600 gpm. The analysis is performed based on using a segment ball valve. The graph in the lower left of Figure 6 shows the calculated installed flow characteristics. Keep in mind the installed flow graphs generated by the worksheet of the reference 4 graph is relative flow, so 1.0 is 100% of the fully open flow, which is different for each of the three cases. What is interesting is the installed gain graphs.
-
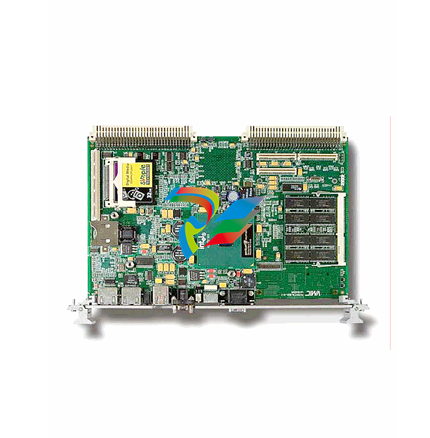
 D20MIC10BASE-T 820-0756 Network card
 -
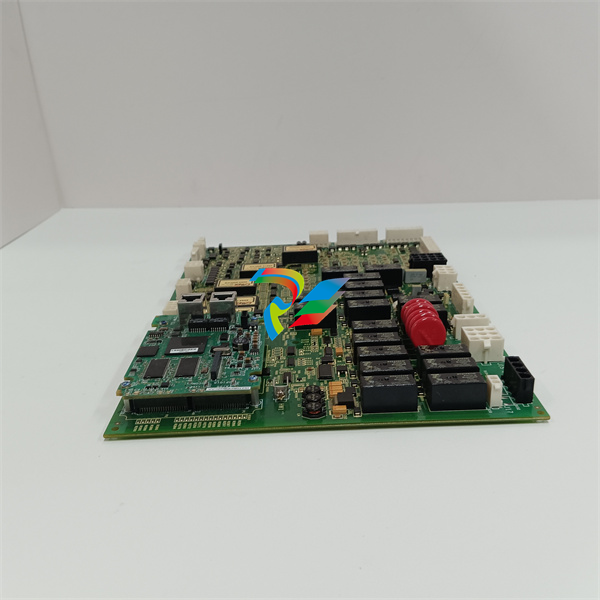
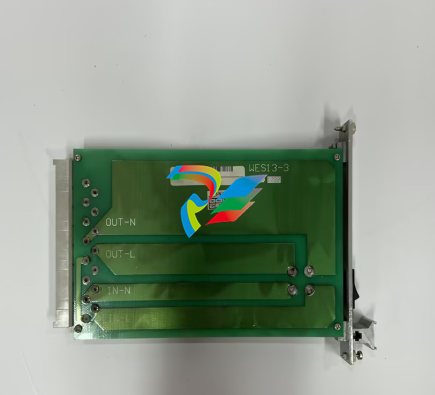
 WES13-3 5167-0001-0210 CPU/Auxiliary Control board
 -
 WES13-3 2508-21001 Embedded digital module
 -
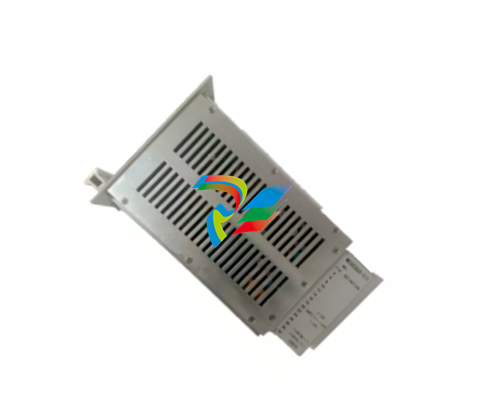
D20ME 526-2005-216943 control module
-
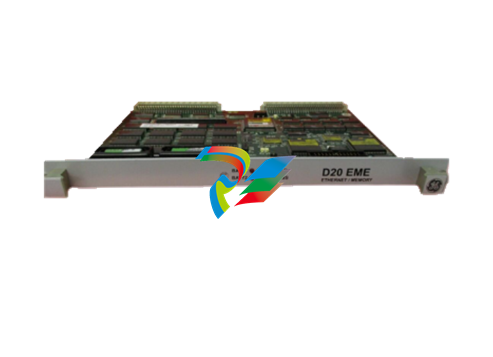
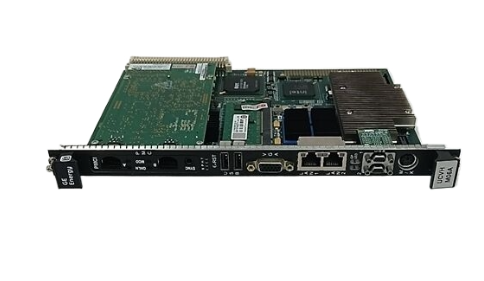
 D20EME 0526-21170-1 Enhanced Master Communications Module for D20 Substation RTUs
 -
.jpg) 2400-21004 / 2010-3101-0442 – Redundant Power Supply Module for Mark VIe Turbine Control
2400-21004 / 2010-3101-0442 – Redundant Power Supply Module for Mark VIe Turbine Control -
 PACSystems™ IC695CPE400 RX3i 64 MB
 -
 DS200DCFBG2BNC DC2000 DC Feedback Board
 -
 OLDI Ethernet interface module 56SAM-844
 -
 IS200BPPBH2CAA Mark VIe Power Supply Module
 -
 IS210MACCH2AEG Motor Control and Communication Module
 -
 IS210MACCH2AGG Mark VIe Speedtronic Turbine Control Module
 -
 IS200AEPAH1AFD Printed circuit board
 -
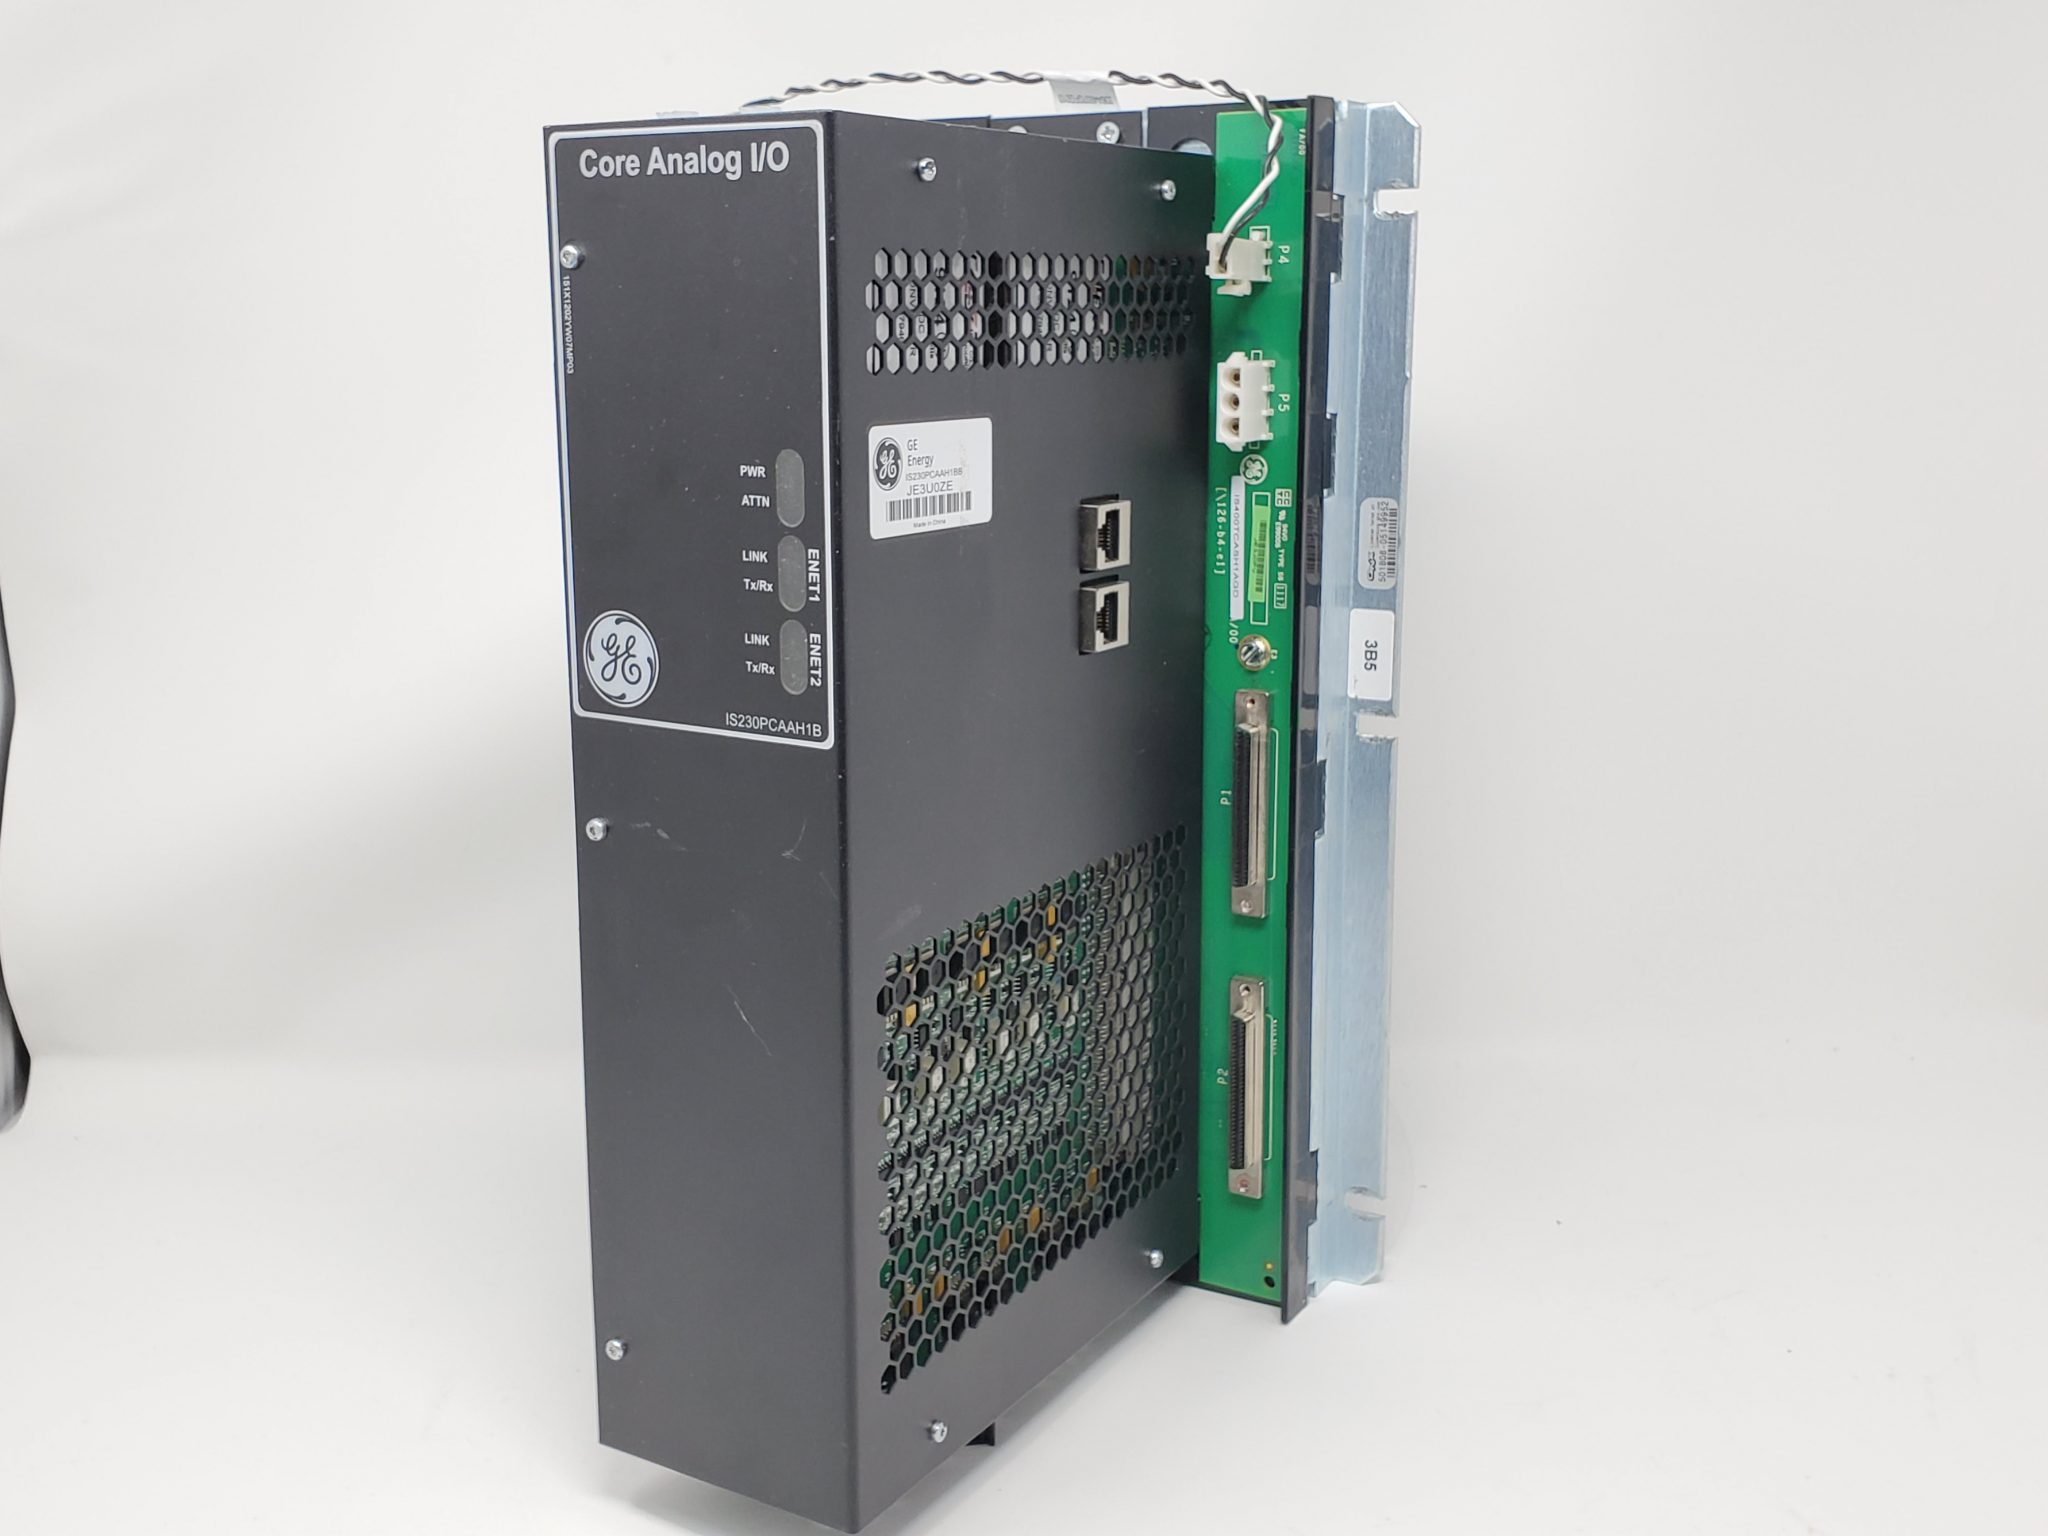
IS200AEPAH1ACB Analog I/O Module
-
 IS200WREAS1ADB AERO TRIP TB DBRD sub-board
 -
 IS200WETAH1AEC large board component made Mark VI system
 -
 IS200AEPAH1AHD A High-Precision Excitation Control Board for Turbine Systems
 -
 IS200WEMAH1AEA Control board
 -
IS210MACCH1AGG processor card
-
 IS230TNRLH1B Discrete Output Modular Assembly
 -
 Mark V Series DS200PCCAG1ACB PCB Power Connect Card
 -
 DS200SI0CG1AEA Instantaneous overcurrent card
 -
 DS200SHVMG1AGE Analog I/O board
 -
 DS200SI0CG1A6A Input/Output Module
 -
 DS200SHVMG1AFE SCR High Voltage Interface Board
 -
 DS200RT8AG3AHC Relay Output Terminal Board
 -
 DS200FSAAG1ABA PCB Field Supply Gate Amplifier Board
 -
 531X307LTBAFG1 F31X307LTBA LAN I/O Terminal Board
 -
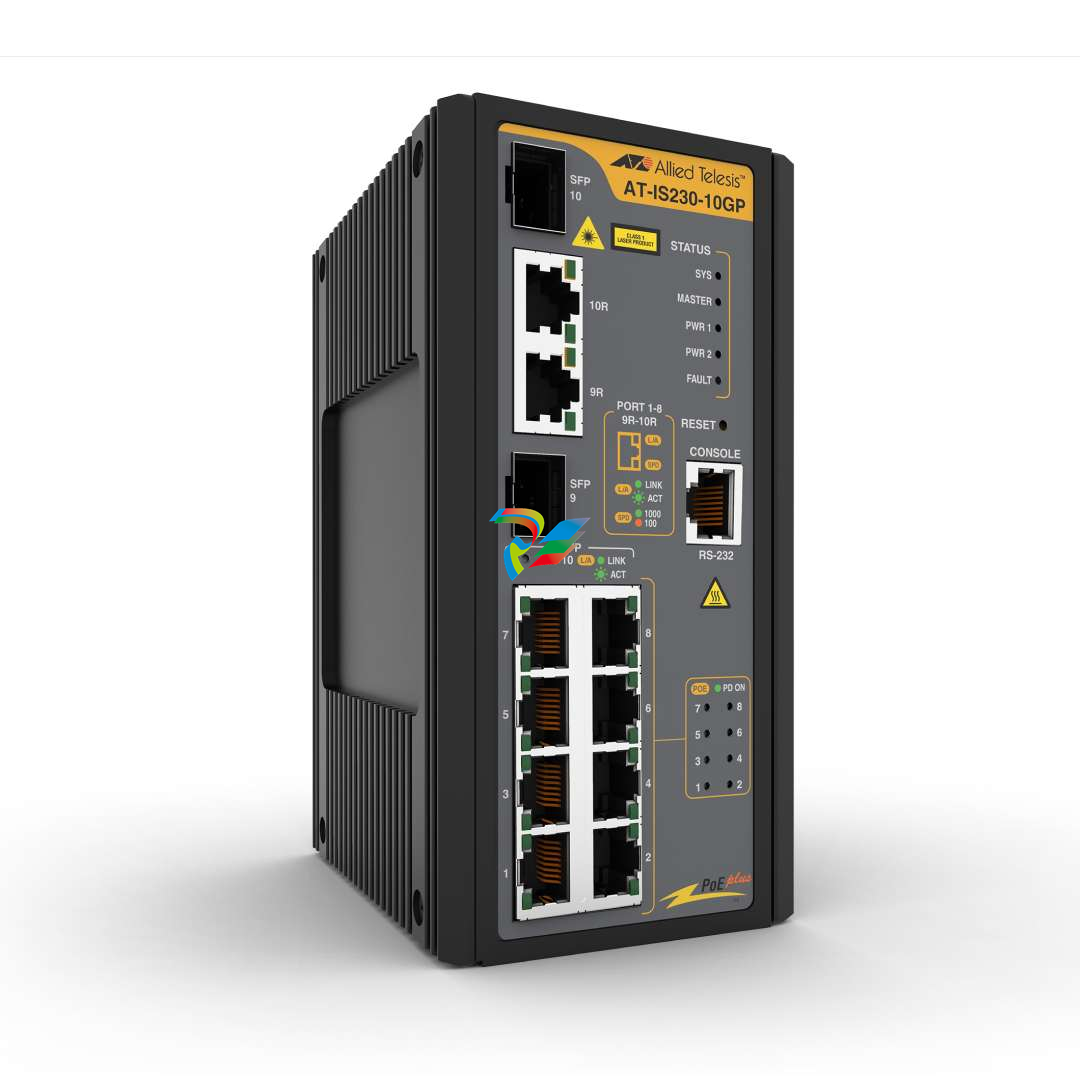
 ABB AFS670 19" Ruggedized Switch AFS670-EREEDDDSSEEEEEEEPZYX05.1.0
 -
 NI Controller for VXI VXIPC-871B
 -
 IS200EPMCH1GE Mark VIe Patch Cord Power Distribution Card
 -
 VMICPCI-7632-03310 IS215UCCAH3A 350-657362-003310J GE gas turbine system control processor board
 -
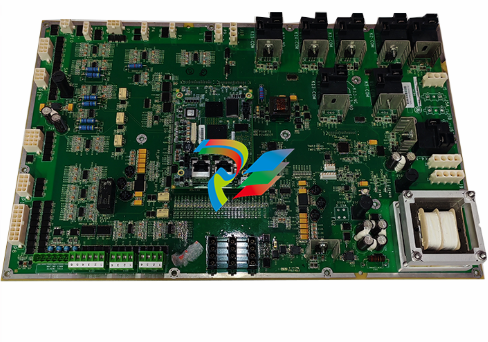
 WEA13-13 2508-21001 Control Module / I/O Board
 -
WES5120 2340-21004 Controller Main Module
-
 WES5120 2340-21006 Field Controller Master Unit Module
 -
WESDAC D20ME 18-MAR-13 Excitation Control Module
-
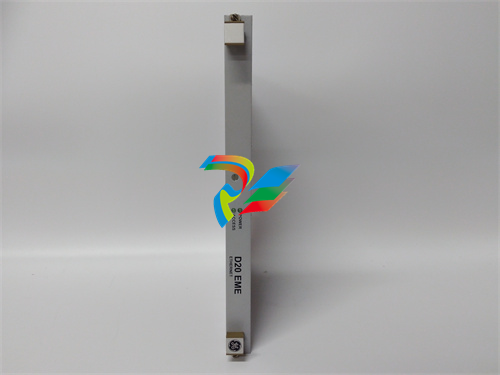 D20 EME 2400-21004 Ethernet communication and expansion module
 -
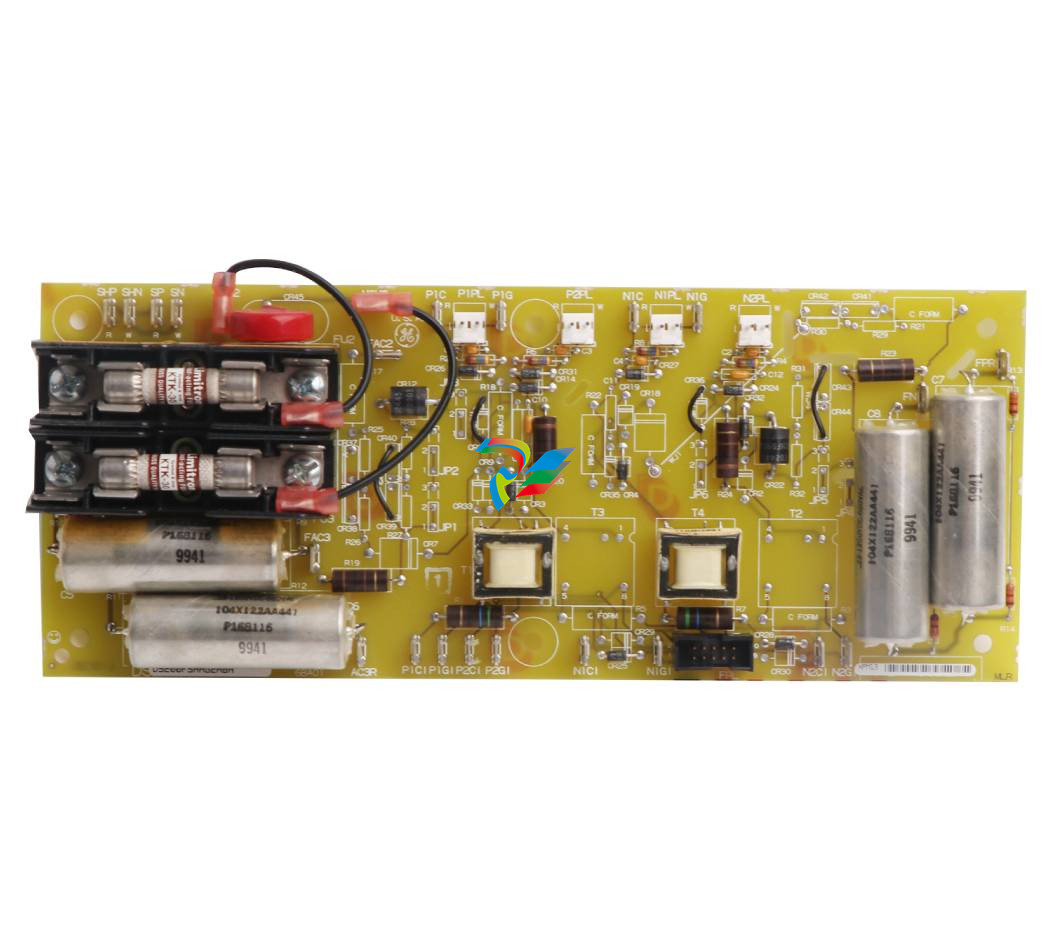
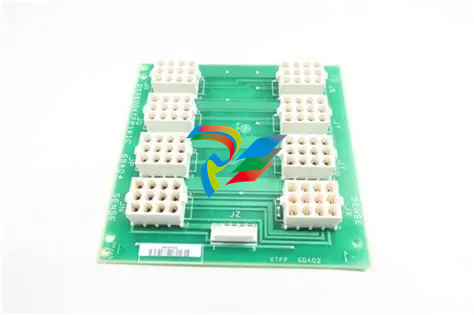 GE DS3800XTFP1E1C Thyristor Fan Out Board Brand
 -
 GE SR745-W2-P1-G1-HI-A-L-R-E Feeder protection relay
 -
 GE IS230TNDSH2A Discrete Output Relay Module Brand
 -
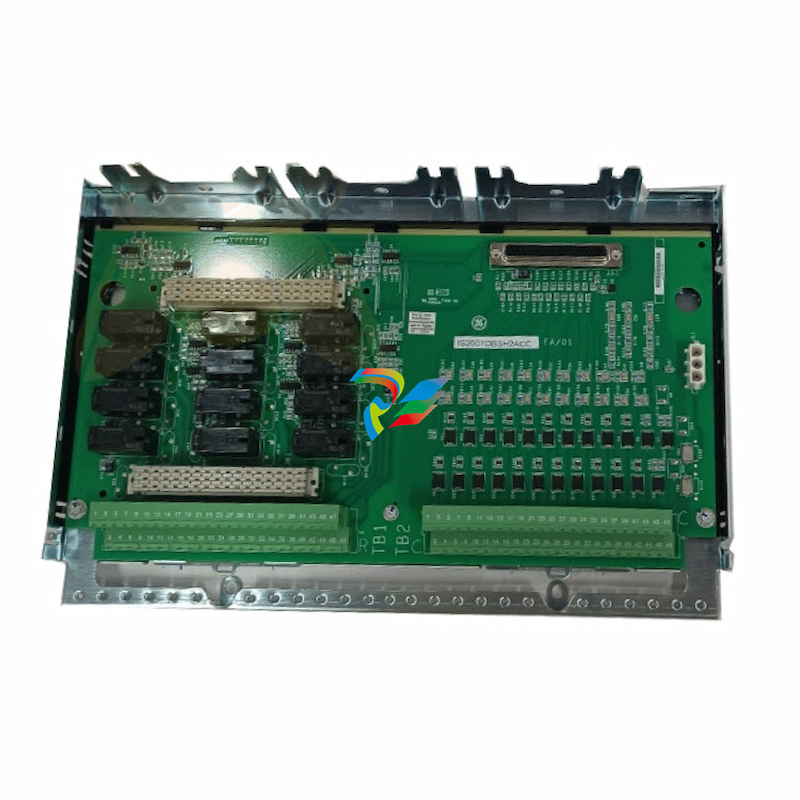 GE Fanuc IS200TDBSH2ACC Mark VI Terminal Board Brand
 -
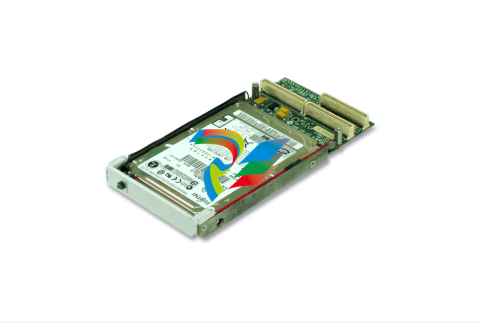 GE PMC-0247RC-282000 350-93750247-282000F Disk Drive
 -
GE PMC-0247RC-282000 350-93750247-282000F Disk Drive
-
 GE VMIVME-1150 Serial Communications Controller
 -
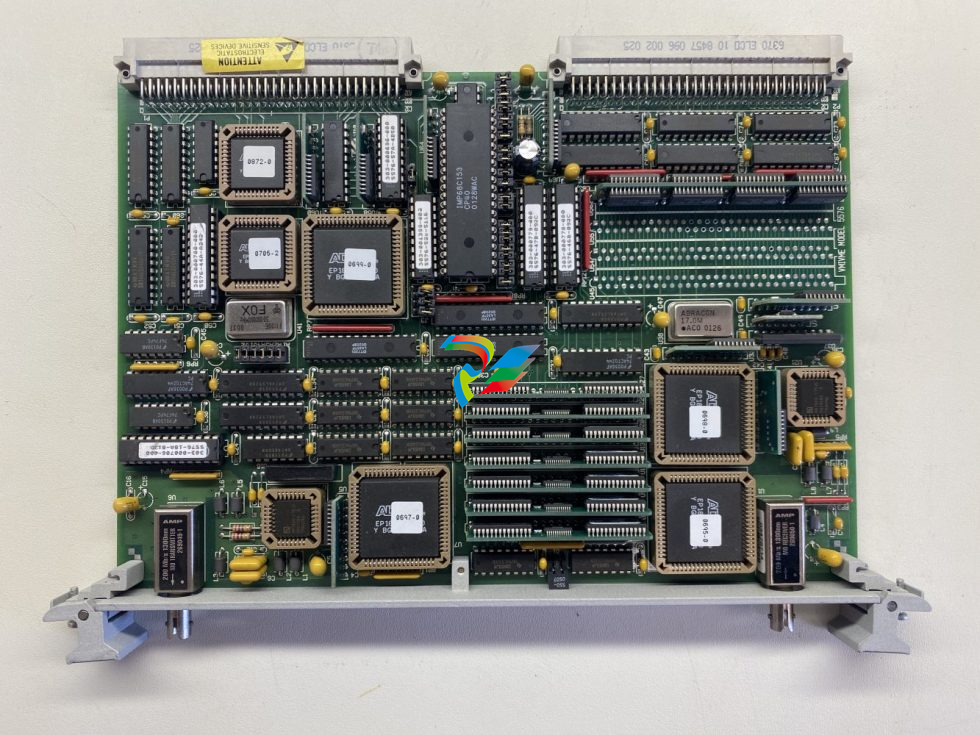 GE VMIVME-5576 Fiber-Optic Reflective Memory with Interrupts
 -
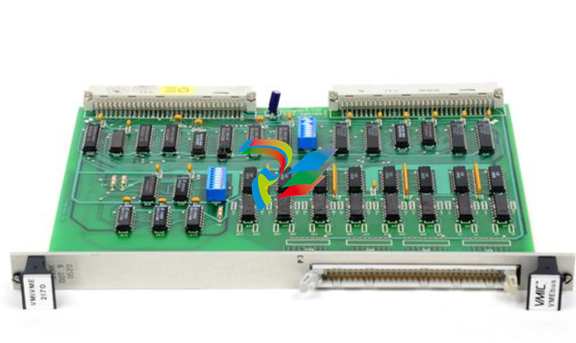 GE VMIC Isolated Digital Output VMIVME-2170A
 -
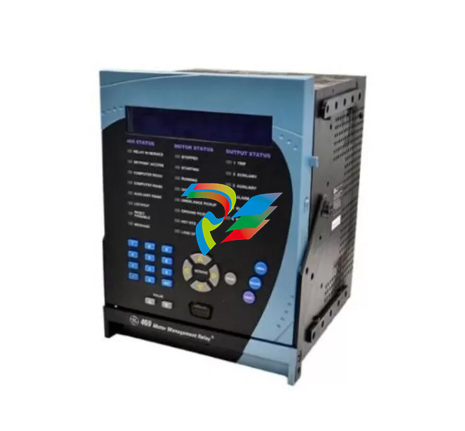
 GE MULTILIN 760 FEEDER MANAGEMENT RELAY 760-P5-G5-S5-HI-A20-R-E
 -
GE IS200AEPAH1BKE IS215WEPAH2BB Printed circuit board
-
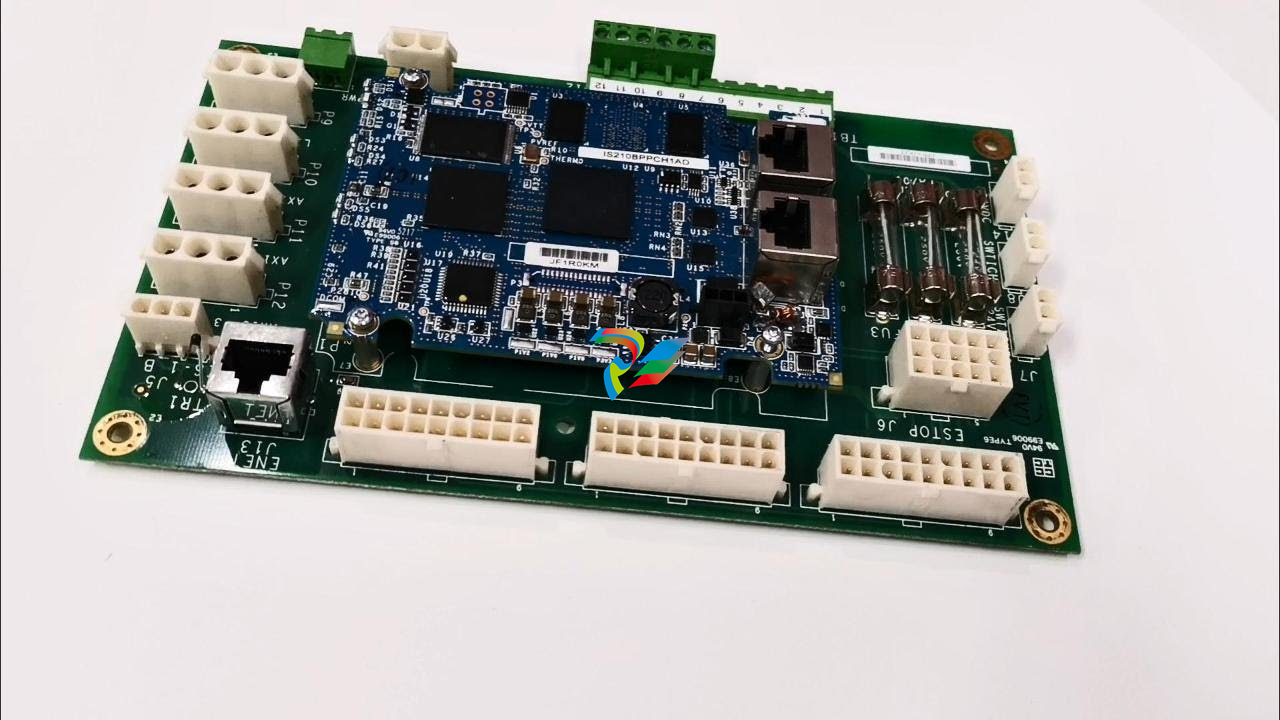 GE IS210BPPCH1A Mark VIe I/O Pack Processor Card
 -
 GE IS220PRTDH1A 336A4940CSP6 High-Performance RTD Input Module
 -
GE IS220PDIAH1BE 336A5026ADP4 Discrete Input Module
-
 GE IS420ESWBH3A IONET Switch Module
 -
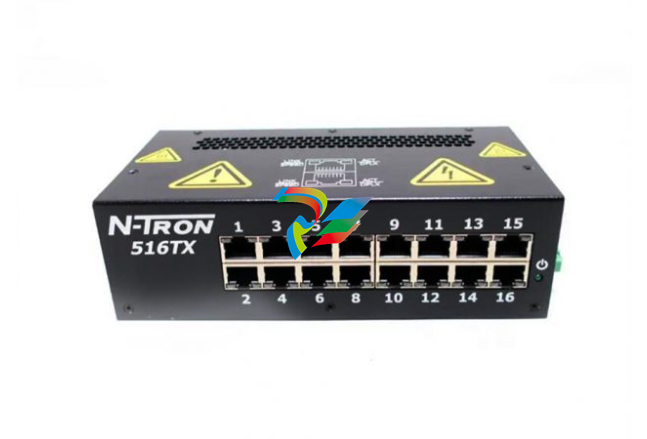 GE 516TX 336A4940DNP516TX 16-port Ethernet switch
 -
 GE EVMECNTM13 Embedded control module
 -
GE EVPBDP0001 EVPBDP032 control module
-
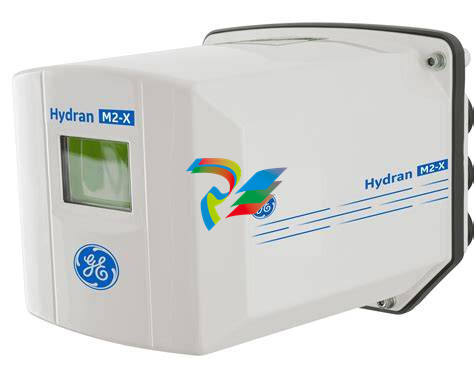 GE Hydran M2-X Enhanced Monitoring with Extended Sensor Life
 -
 GE UR6CH Digital I/O Module
 -
 GE IC695CPU315-CD Central processing unit
 -
 GE 531X305NTBAMG1 DR Terminal Board
 -
 GE 531X305NTBALG1 NTB/3TB Terminal Board 531X Series
 -
 GE 531X305NTBAJG1 NTB/3TB Terminal Board.
 -
GE 531X305NTBAHG1 NTB/3TB Terminal Board 531X
-
 GE 531X305NTBAEG1 is a PCB that functions as a DR terminal board.
 -
General Electric 531X305NTBACG1 NTB/3TB Terminal Board 531X
-
 GE Digital Energy D20 Analog Input Module
 -
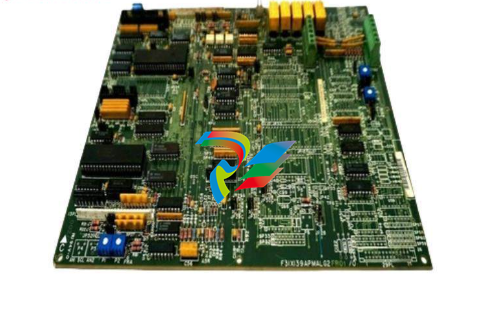
 GE 94-164136-001 main board Control board
 -
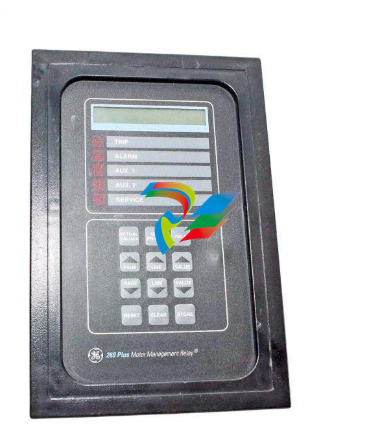 GE 269 PLUS-D/O-100P-125V Digital motor relay
 -
 GALIL DMC-9940 High-performance motion controller
 -
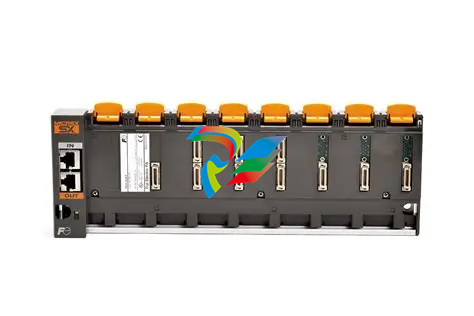
FUJI NP1BS-08 base plate
-
 FUJI NP1Y32T09P1 Transistor drain type digital output module
 -
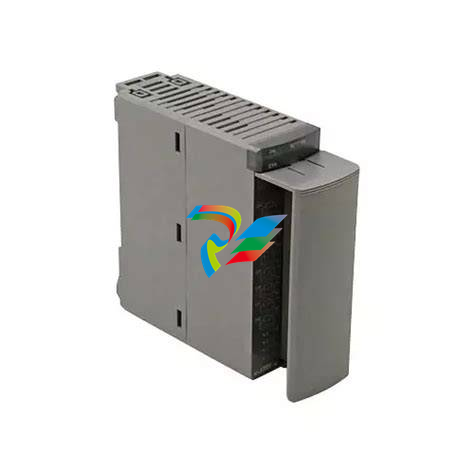
 FUJI NP1Y16R-08 Digital Output Module
 -
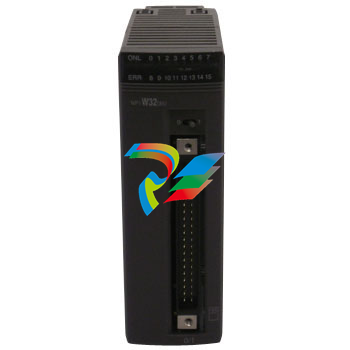
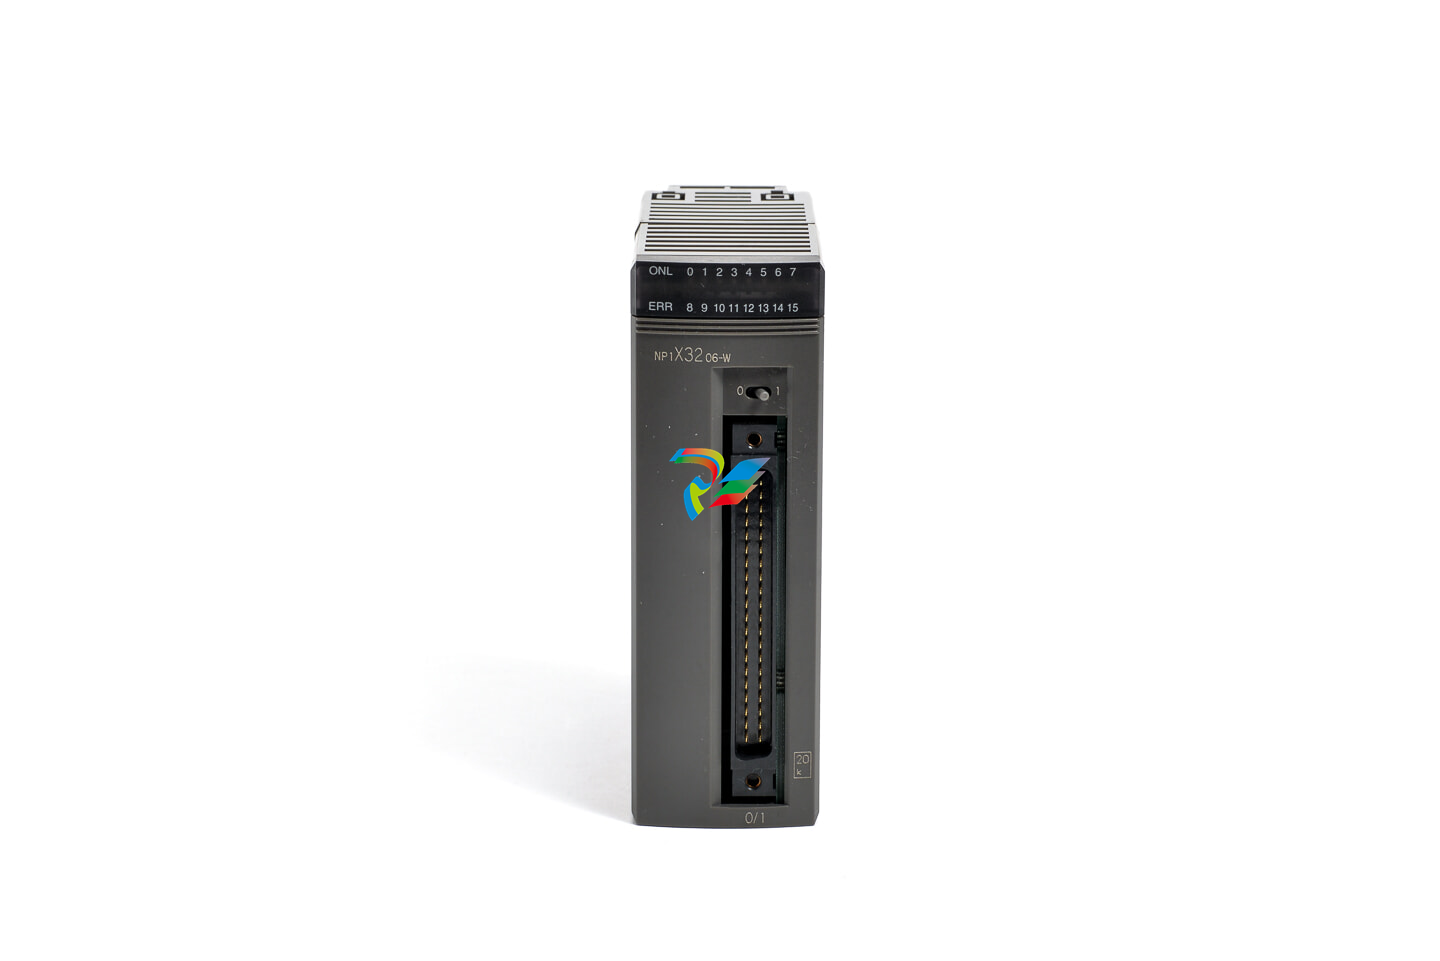 FUJI NP1X3206-A High-speed digital input module
 -
 FUJI NP1AYH4I-MR current output module
 -
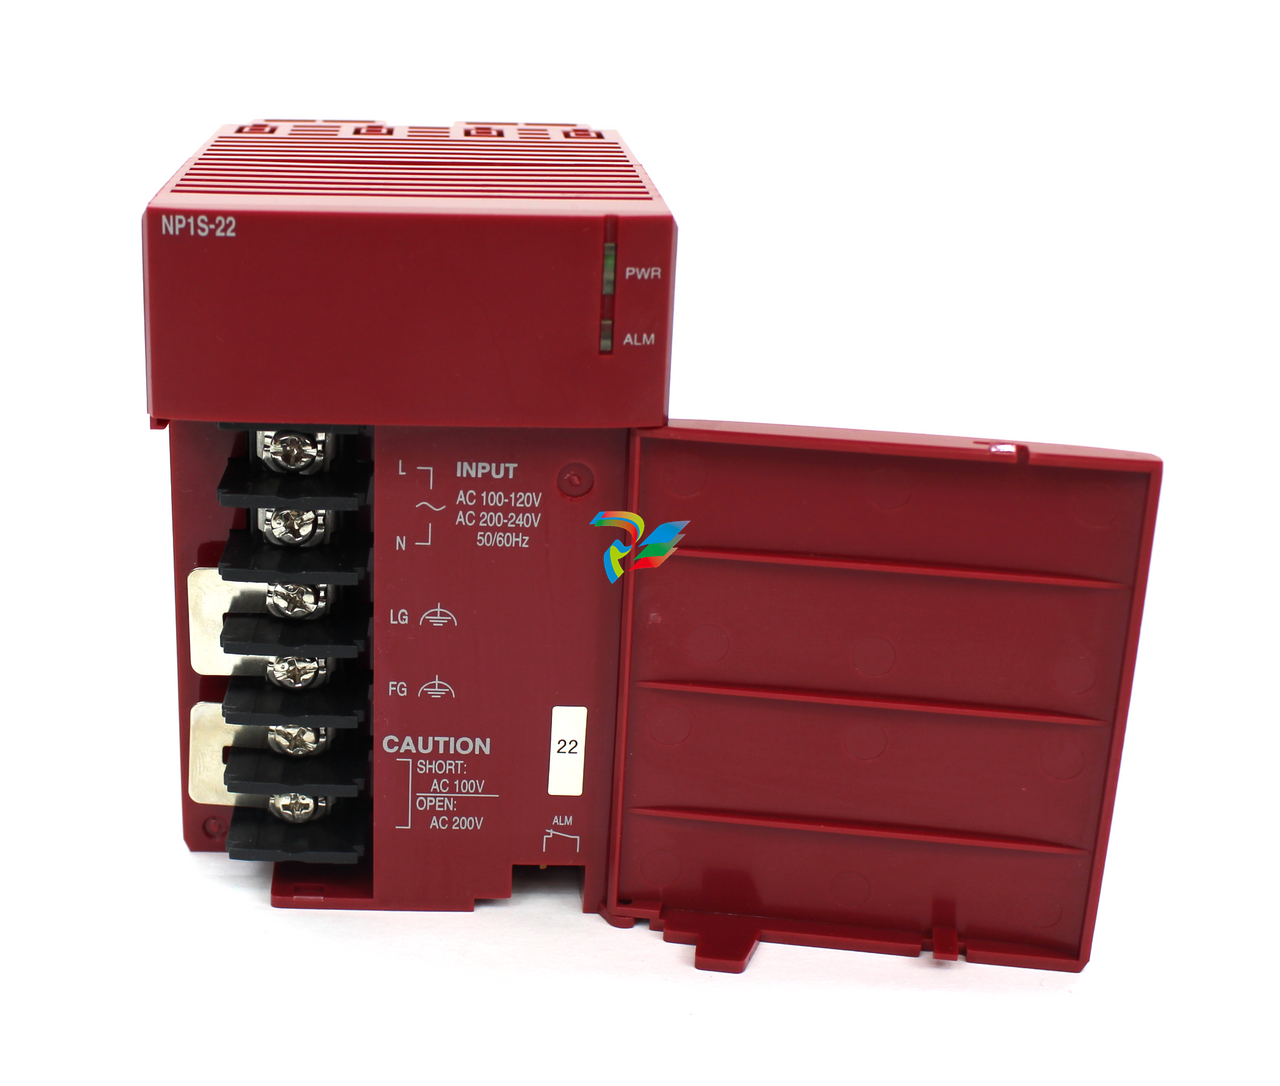 FUJI NP1S-22 Power module redundancy
 -
 FUJI RPXD2150-1T servo drive module
 -
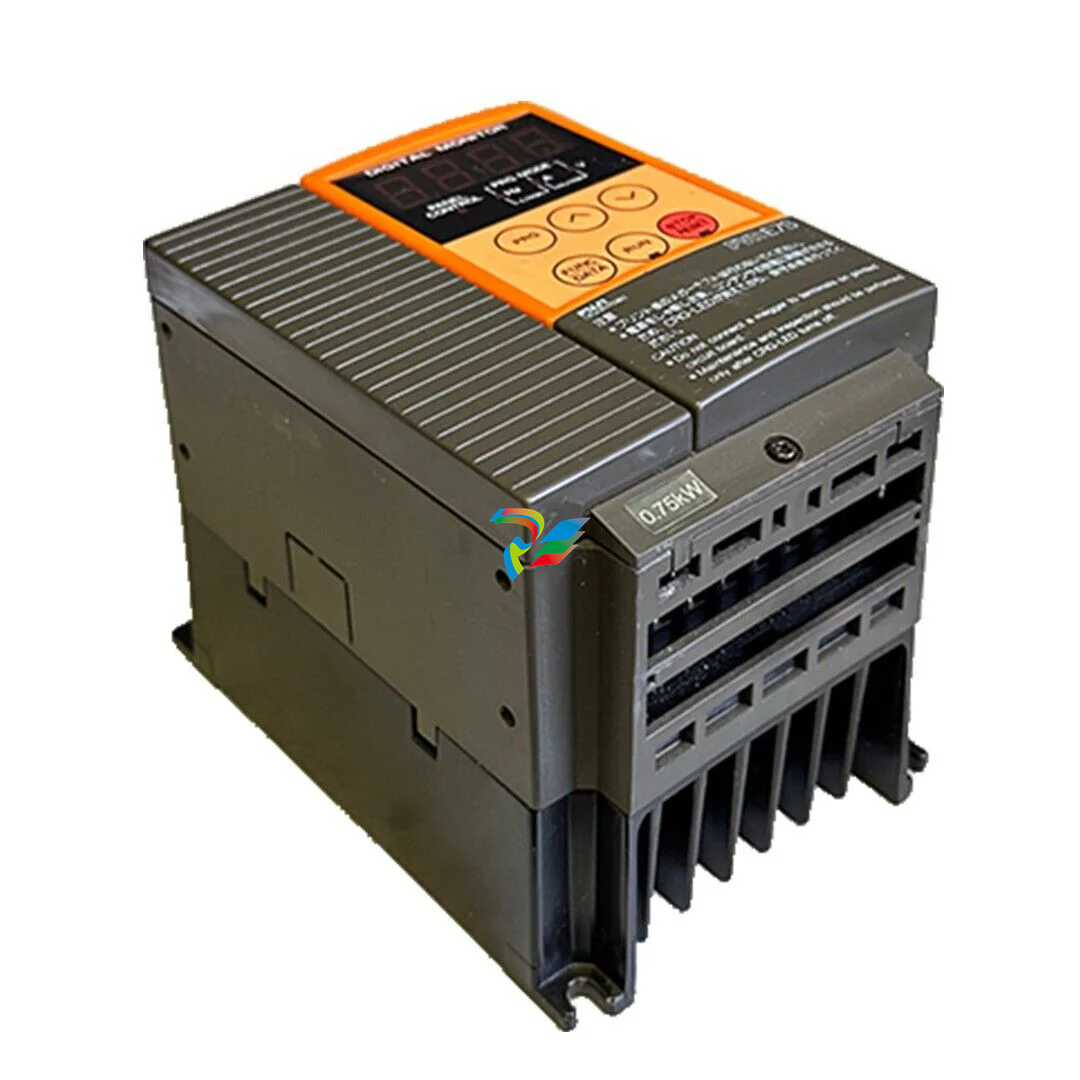
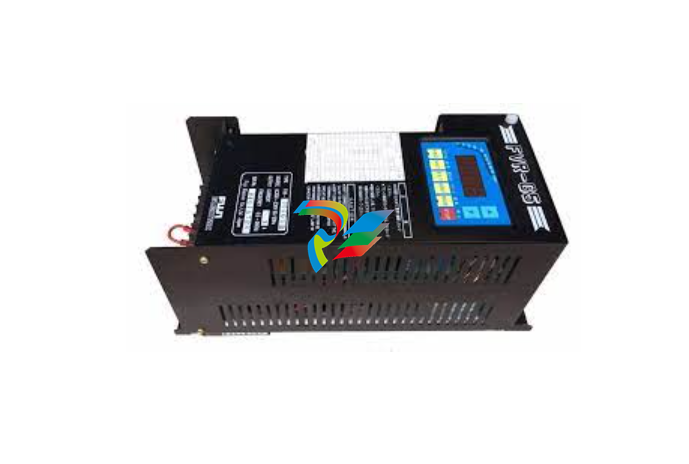
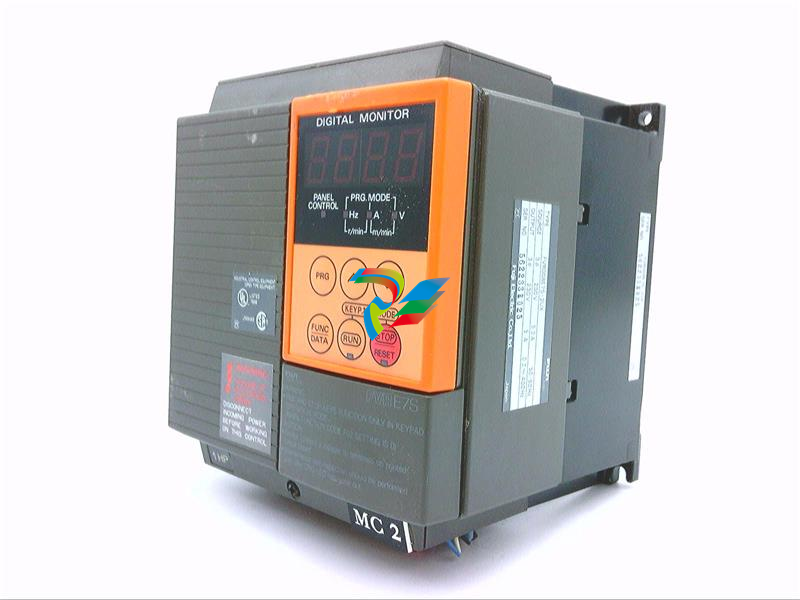 FUJI FVR008E7S-2UX Ac frequency converter
 -
 FUJI Ac frequency converter FVR008E7S-2
 -
 FUJI FVR004G5B-2 Small general-purpose frequency converter
 -
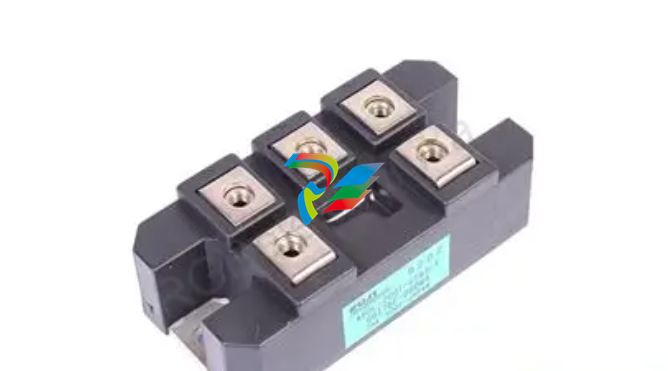 FUJI A50L-2001-0232 Industrial control module
 -
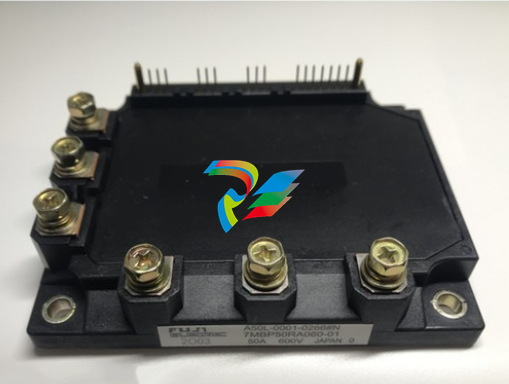 FUJI A50L-001-0266#N High-performance servo amplifier
 -
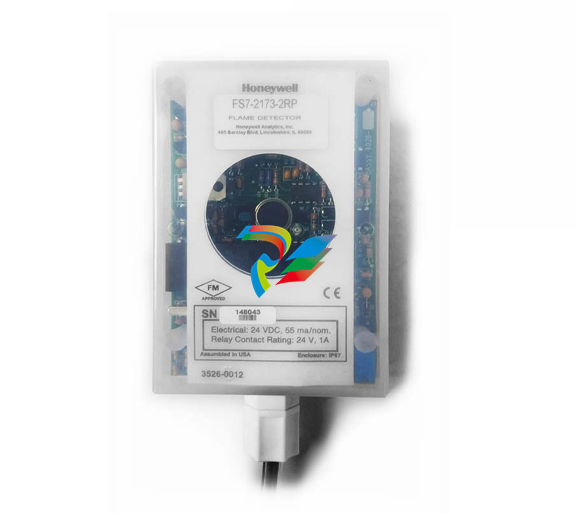 Honeywell FS7-2173-2RP Gas sensor
 -
 Honeywell 10106/2/1 Digital Input Module in Stock
 -
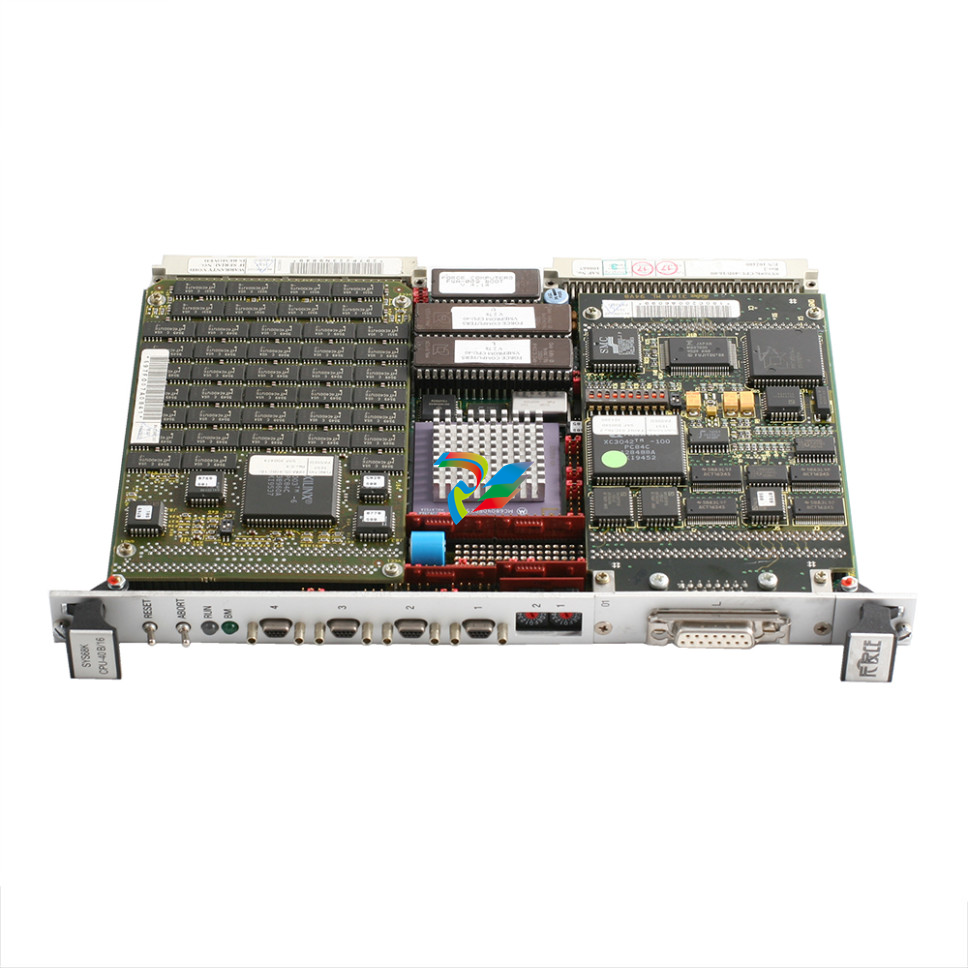
FRCE SYS68K CPU-40 B/16 PLC core processor module
-
Foxboro FBM I/O cards PBCO-D8-009
-
 Foxboro AD916AE Digital Control System (DCS) Module
 -
 GE SR750-P5-G5-S5-HI-A20-R-E Multilin Relay
 -
.jpg) FOXBORO H90 H90C9AA0117S Industrial Computer Workstation
FOXBORO H90 H90C9AA0117S Industrial Computer Workstation -
FOXBORO RH928AW | I/A Series Relay Output Module
-
.jpg) Foxboro N-2AX+DIO Multi-functional input/output module
Foxboro N-2AX+DIO Multi-functional input/output module -
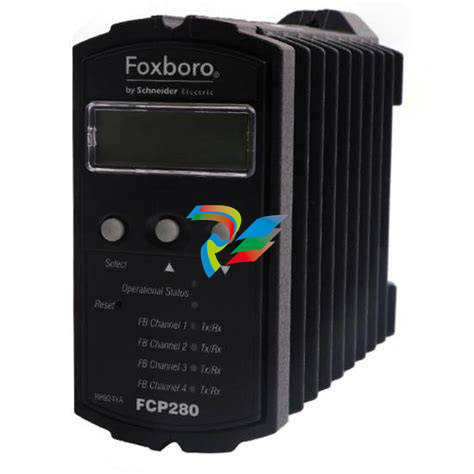 Foxboro RH924WA FCP280 Fiber Optic Network Adapter
 -
 FOXBORO H92 Versatile Hardware Component In
 -
 Foxboro FBM218 P0922VW HART® Communication Redundant Output Interface Module
 -
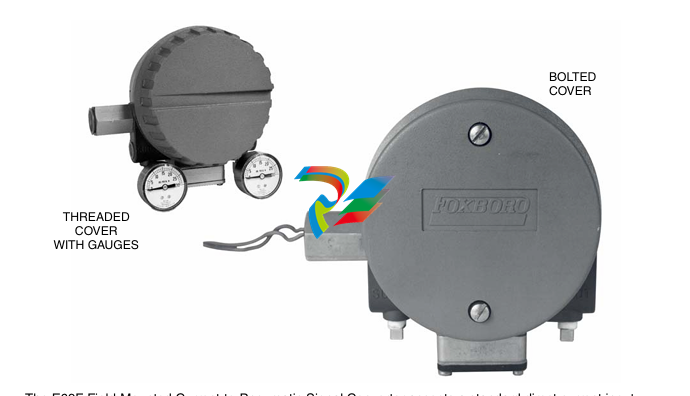
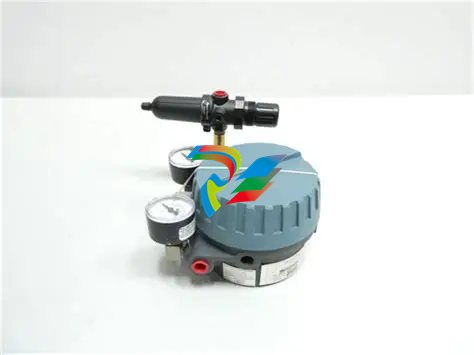
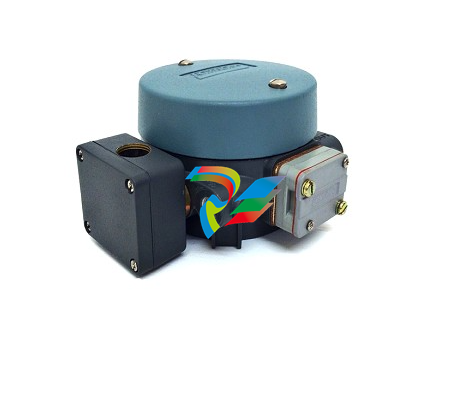 Foxboro E69F-TI2-J-R-S E69F Series Current-To-Pneumatic Signal Converter
 -
 Foxboro E69F-BI2-S Converter
 -
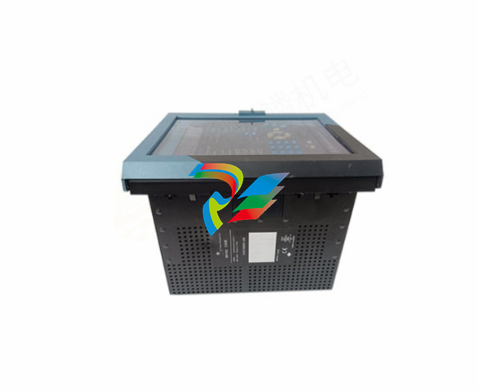
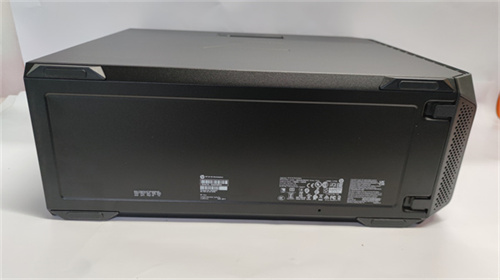
.jpg) Foxboro H92A049E0700 The host of the DCS control station
Foxboro H92A049E0700 The host of the DCS control station -
 Foxboro H90C9AA0117S Industrial computer workstation
 -
 Foxboro RH101AA High-performance industrial control module
 -
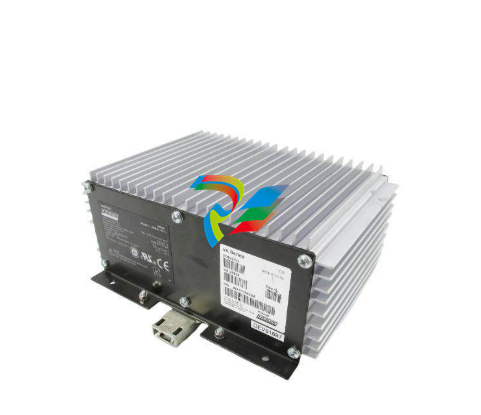 Foxboro P0922YU FPS400-24 I/A Series Power supply
 -
.png) FOXBORO P0973LN Chassis-based managed switch with independent power supply
FOXBORO P0973LN Chassis-based managed switch with independent power supply -
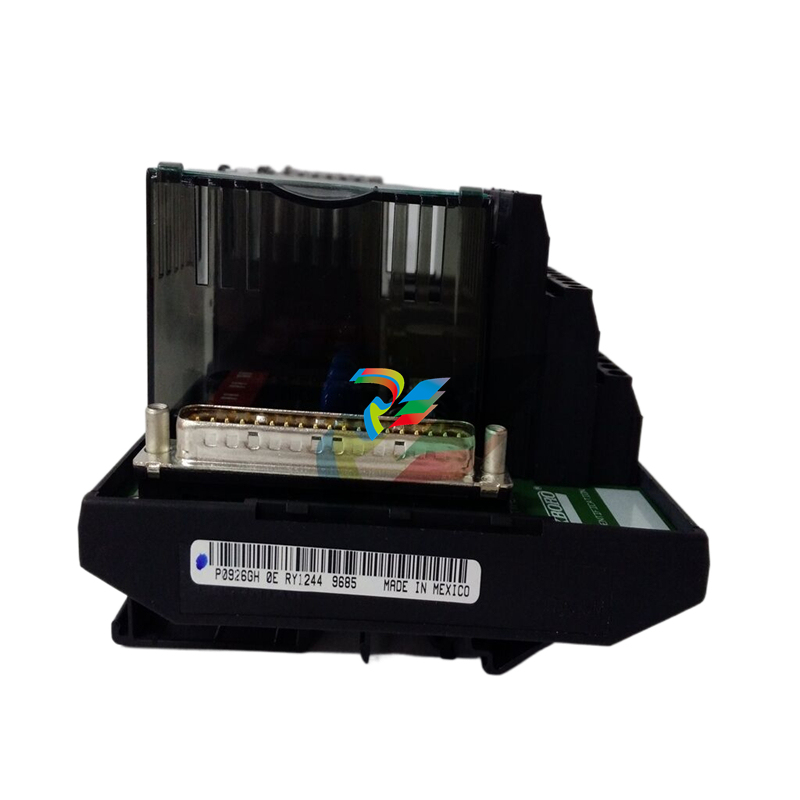
.jpg) FOXBORO P0926PA Input/output module
FOXBORO P0926PA Input/output module -
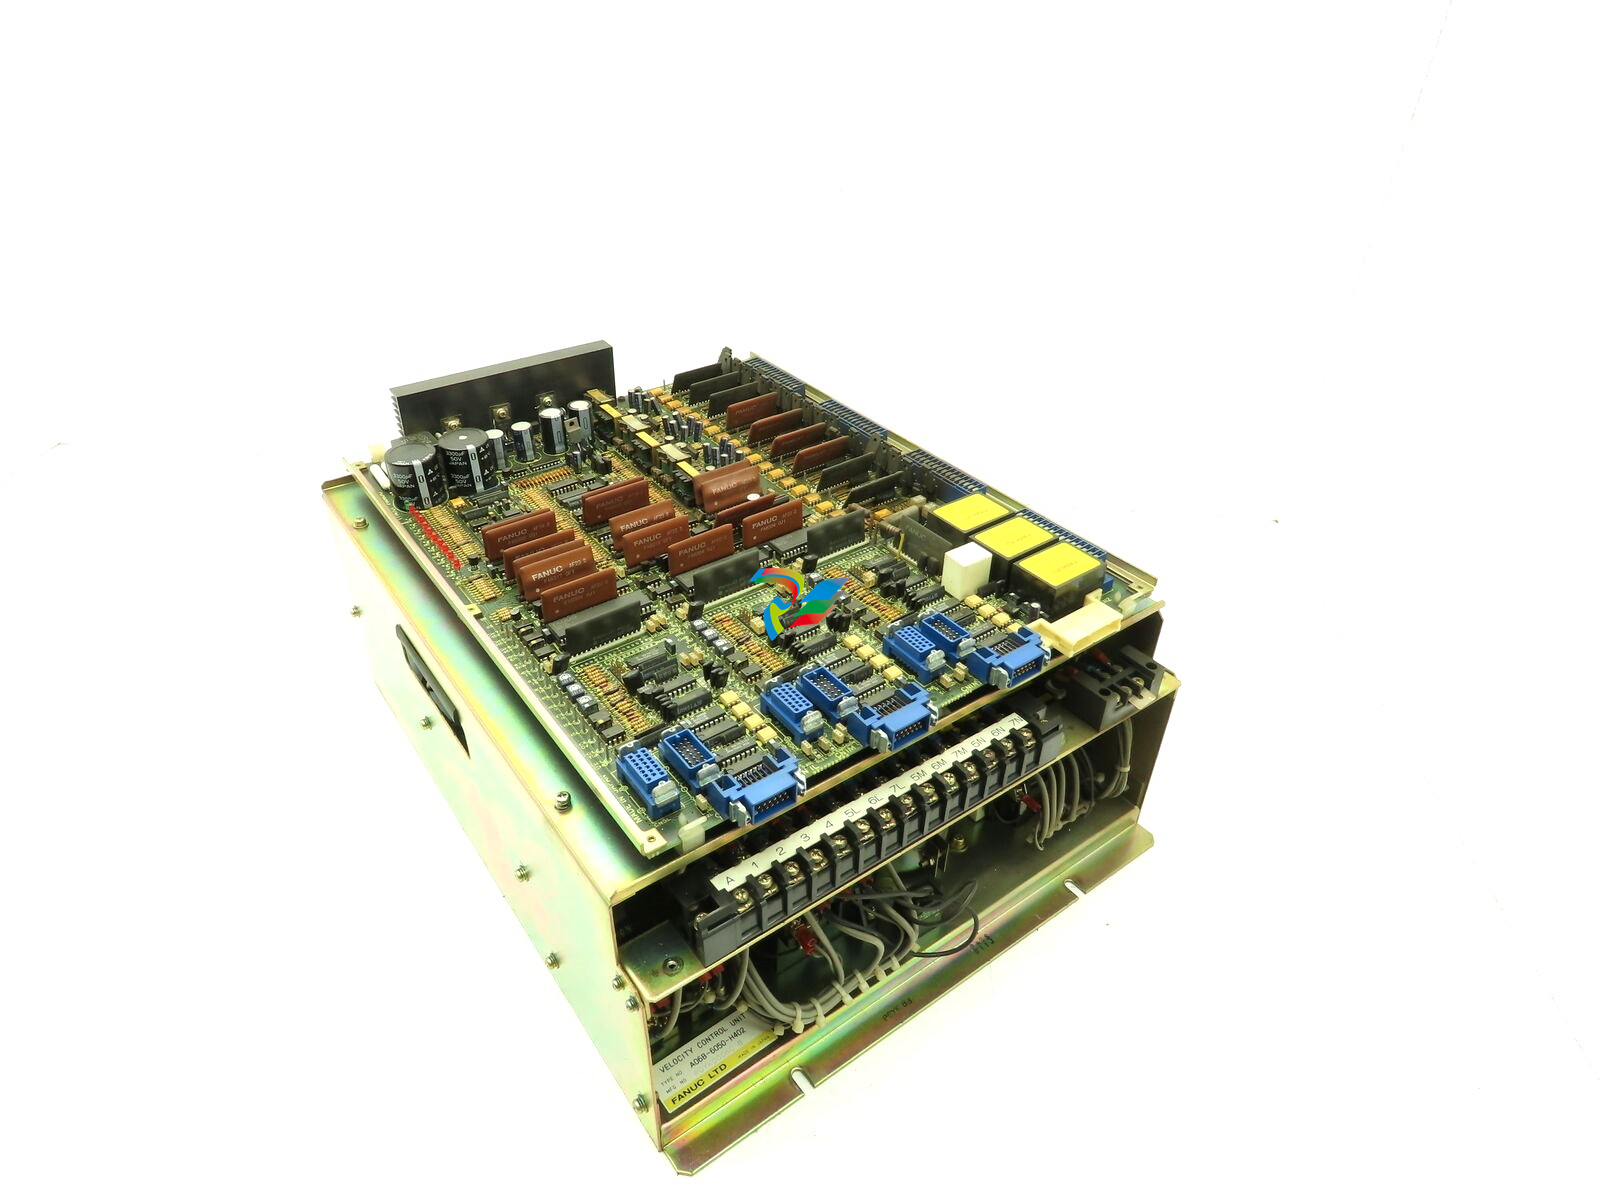 Fanuc A06B-6050-H402 3 AXIS ANALOG AC SERVO DRIVE
 -
.jpg) FOXBORO L0130AD L0130AE-0H Power module group
FOXBORO L0130AD L0130AE-0H Power module group -
_lVjBYb.jpg) FOXBORO 0399085B 0303440C+0303458A Combination Control Module
FOXBORO 0399085B 0303440C+0303458A Combination Control Module -
 FOXBORO SY-0399095E (SY-0303451D+SY-0303460E) Process control board
 -
.jpg) FOXBORO 0399071D 0303440C+0303443B Input/Output (I/O) Module
FOXBORO 0399071D 0303440C+0303443B Input/Output (I/O) Module -
.jpg) FOXBORO RH924UQ Redundant Controller module
FOXBORO RH924UQ Redundant Controller module -
 FFOXBORO E69F-TI2-S current pneumatic converter
 -
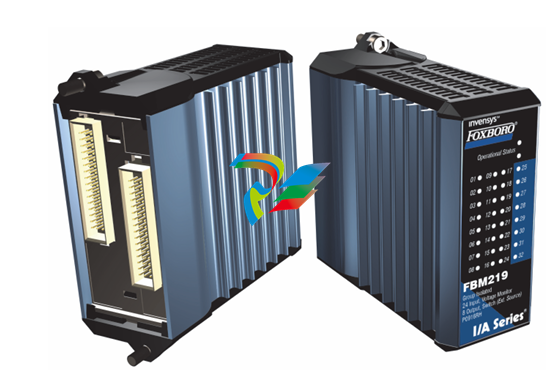 FOXBORO FBM219 RH916RH Discrete I/O Module
 -
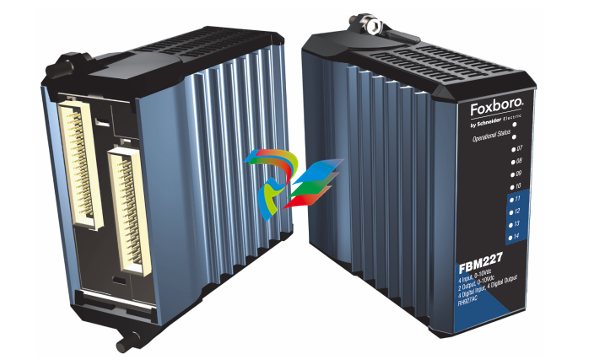 FOXBORO FBM227 P0927AC Module
 -
.jpg) FOXBORO 0399144 SY-0301059F SY-1025115C/SY-1025120E I/O module
FOXBORO 0399144 SY-0301059F SY-1025115C/SY-1025120E I/O module -
.jpg) FOXBORO SY-60399001R SY-60301001RB Industrial Control Module
FOXBORO SY-60399001R SY-60301001RB Industrial Control Module -
 FOXBORO 0399143 SY-0301060R SY-1025115C SY-1025120E Combined control board
 -
 FOXBORO 873EC-JIPFGZ electrodeless conductivity analyzer
 -
 FOXBORO P0916PH (High-density HART I/O Module)
 -
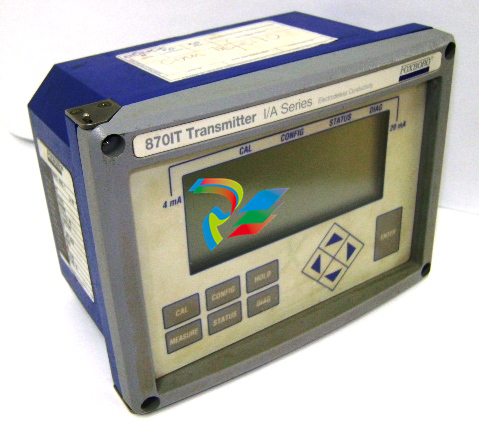 FOXBORO 870ITEC-AYFNZ-7 Intelligent Electrochemical Transmitters
 -
 FOXBORO Compact FBM240. Redundant with Readback, Discrete
 -
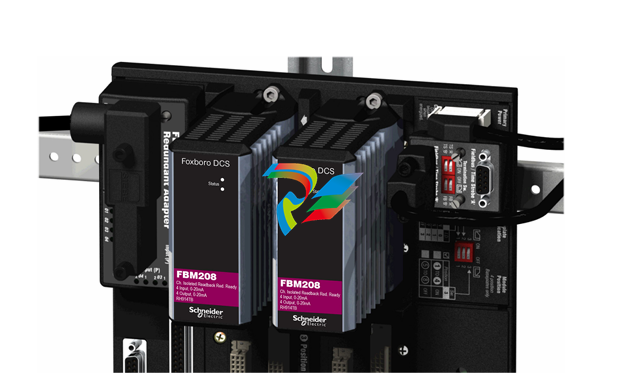 FOXBORO FBM208/b, Redundant with Readback, 0 to 20 mA I/O Module
 -
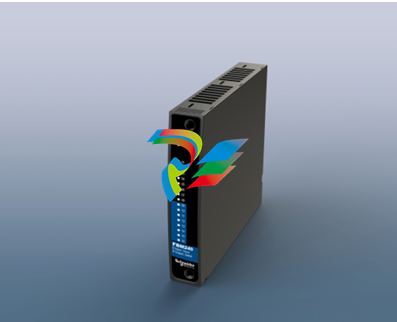
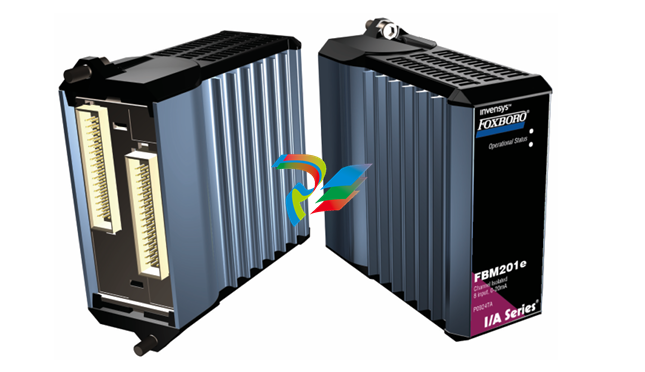 FOXBORO FBM201e Analog Input (0 to 20 mA) Interface Modules
 -
.jpg) FOXBORO P0916WG Terminal cable
FOXBORO P0916WG Terminal cable -
 FOXBORO P0926MX 2-Port Splitter
 -
.jpg) FOXBORO AD908JQ High-Frequency Module
FOXBORO AD908JQ High-Frequency Module -
.jpg) FOXBORO AD916CC Processor module
FOXBORO AD916CC Processor module -
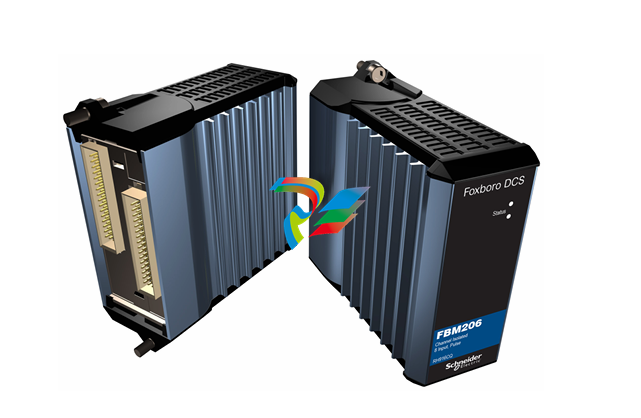 Foxboro DCS FBM206 Pulse Input Module
 -
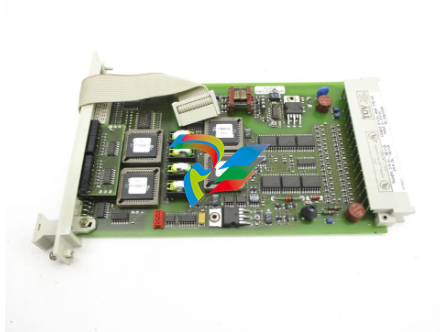
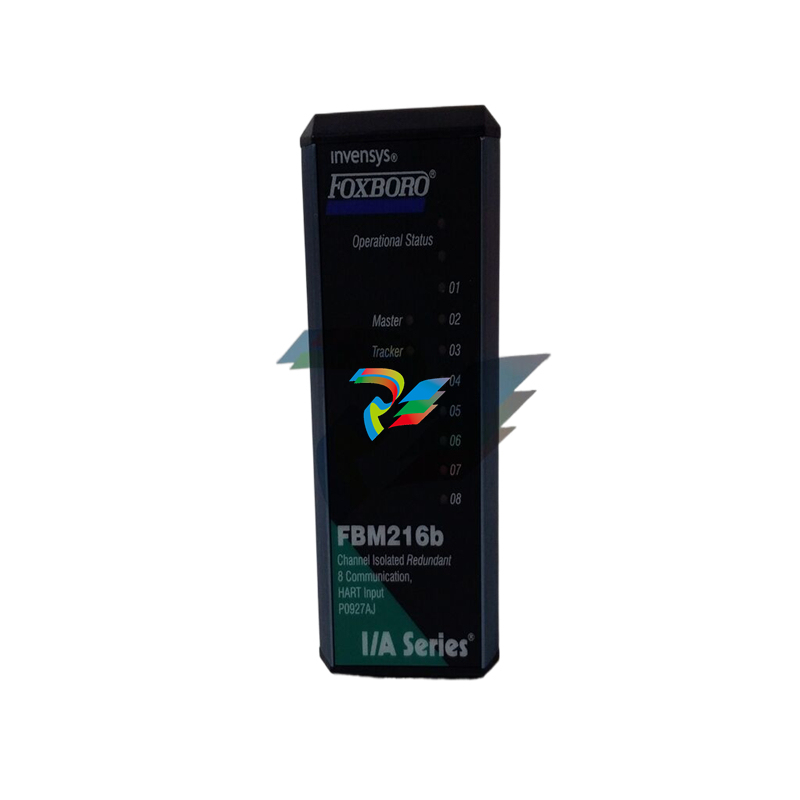
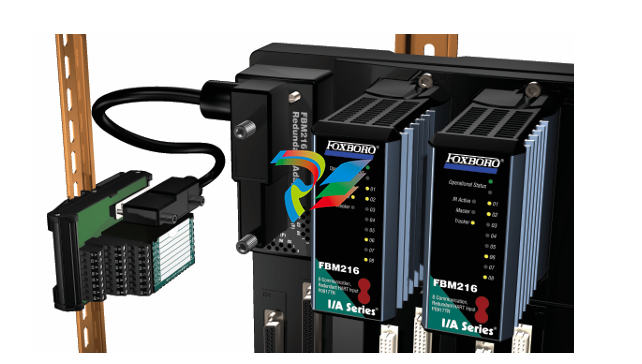 FOXBORO FBM216 HART® Communication Redundant Input Interface Module
 -
 Foxboro p0903nu 1×8 unit sub-component module
 -
 Foxboro P0911SM Industrial control module
 -
 Foxboro CM902WM I/O module
 -
 Foxboro CM902WL Power module