
Understanding Loop Diagrams and Process Loop Sheets
The example process loop sheet in Figure 4 shows that the influent flow meter sends a 4–20 mA signal via analog output to all devices throughout the diagram. In addition to providing a flow rate signal to the control system, the meter also records the average daily flow and keeps a 24-hour record, a process known as totalizing (denoted by the “Q” in the ISA-style identifier tag). The A and B labels on the FIRQ symbols indicate that the same information is transmitted to both devices, meaning that there are devices that show the totalized flow in both the control room and the administration center.
The line types used on a process loop sheet are the same as those used on the process part of a loop diagram. That is, dashed lines for electrical signals and solid lines for piping. Figure 5 provides an overview of the line types commonly used to process loop sheets. The intent of using process loop sheets is to provide enough detailed information so that an installation electrician can know how to wire a piece of equipment and how it is used.

Further examples
Both loop diagrams and process loop sheets can range from simple to complex depending on the equipment (instrumentation, devices, control elements, etc.) they describe. The example of a complex loop diagram in Figure 6 is from ISA-5.4. It shows an orifice-plate-based flow transmitter (which uses a differential pressure transmitter to read the flow based on the pressure drop across an orifice plate) and a flow control valve on a pumped fill line to a tank.
The field I/O wiring passes through a junction box in a cable spreading room; there is another set of junction terminals at the rear of a panel; then, there is a flow controller/PLC shown in a front-facing panel. Though showing older technology, the diagram in Figure 6 shows the amount of wiring/installation details that can be included on a loop diagram.

Figure 7 shows a more complex process loop sheet. In this example, multiple I/O signals are wired to a chemical feed pump. The process loop sheet shows how the signals are wired from the pump to an interface junction box, to a fluoride system control panel, and then into a PLC system. Though it does not show the exact wire terminal details, it shows the flow of the signals so an installation or maintenance technician can easily see where the signals are being routed as part of the system.
Depending on the type and complexity of the project, it may be preferable to create a set of loop diagrams, a set of process loop sheets, or a combination of both. This will depend on the system designer and what they feel is necessary to provide clear instructions to the installation electrician for the system. Ideally, if both loop diagrams and process loop sheets are created, they can be used together to create an accurate account of how the system should be installed and how it has been installed once construction/commissioning is complete.
Summary
Loop diagrams and process loop sheets are two types of detail drawings that, though they take time to prepare, can result in considerable savings in the construction, installation and commissioning phases of a project. These savings result from the installation electrician having clear instructions on how to wire and test the system instead of doing the detailed wiring design on-the-fly in the field as part of the construction process.
The production of loop diagrams and process flow sheets also makes it possible for many design issues to be seen and rectified during the design phase rather than during construction. Though there is a cost to prepare these drawings, the benefits of having them greatly outweigh the preparation cost. Hence, many instrumentation professionals refer to loop diagrams and process loop sheets as the “instrumentation engineer’s goldmine”—they are worth their weight in gold when undertaking a project.Understanding Loop Diagrams and Process Loop Sheets
From an installation and maintenance electrician’s point of view, two of the most useful types of drawings that can be included in a contract drawing set are loop diagrams and process loop sheets. These detail drawings show how each piece of equipment (e.g., instrument, motor starter, valve actuator, etc.) is to be wired to the control system. This article provides an overview of loop diagrams/process loop sheets and explains why creating and maintaining them is worth the effort.
From P&IDs to process loop sheets and diagrams
Piping and instrument diagrams (P&IDs) are developed at the beginning of a project to define the equipment, piping and automation and control components needed to implement a process, including the control loops. P&ID drawings provide an overall summary of the process. Together with facility layout drawings, the P&ID drawings provide an overall view of a facility, what it does and where the equipment is located. For large facilities, an additional set of drawings called process flow diagrams (PFDs) are sometimes created to summarize the P&IDs even further.
-
 GE SR745-W2-P1-G1-HI-A-L-R-E Feeder protection relay
 -
 GE IS230TNDSH2A Discrete Output Relay Module Brand
 -
 GE Fanuc IS200TDBSH2ACC Mark VI Terminal Board Brand
 -
 GE PMC-0247RC-282000 350-93750247-282000F Disk Drive
 -
GE PMC-0247RC-282000 350-93750247-282000F Disk Drive
-
 GE VMIVME-1150 Serial Communications Controller
 -
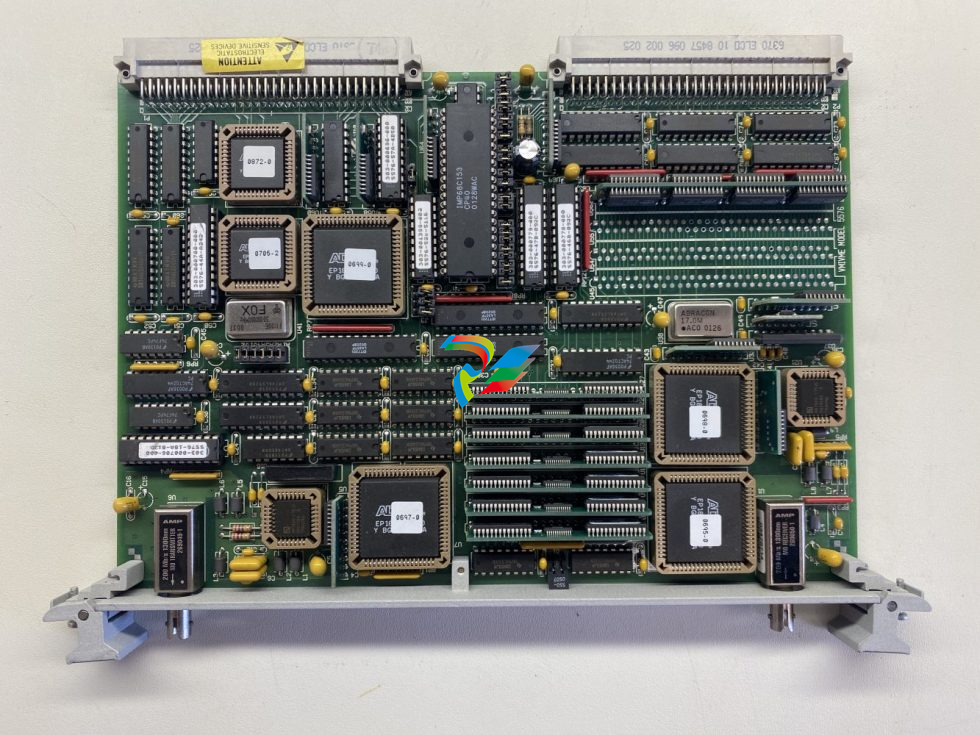 GE VMIVME-5576 Fiber-Optic Reflective Memory with Interrupts
 -
 GE VMIC Isolated Digital Output VMIVME-2170A
 -
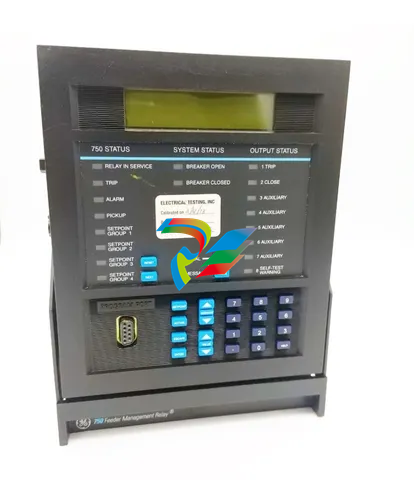 GE MULTILIN 760 FEEDER MANAGEMENT RELAY 760-P5-G5-S5-HI-A20-R-E
 -
 GE IS200AEPAH1BKE IS215WEPAH2BB Printed circuit board
 -
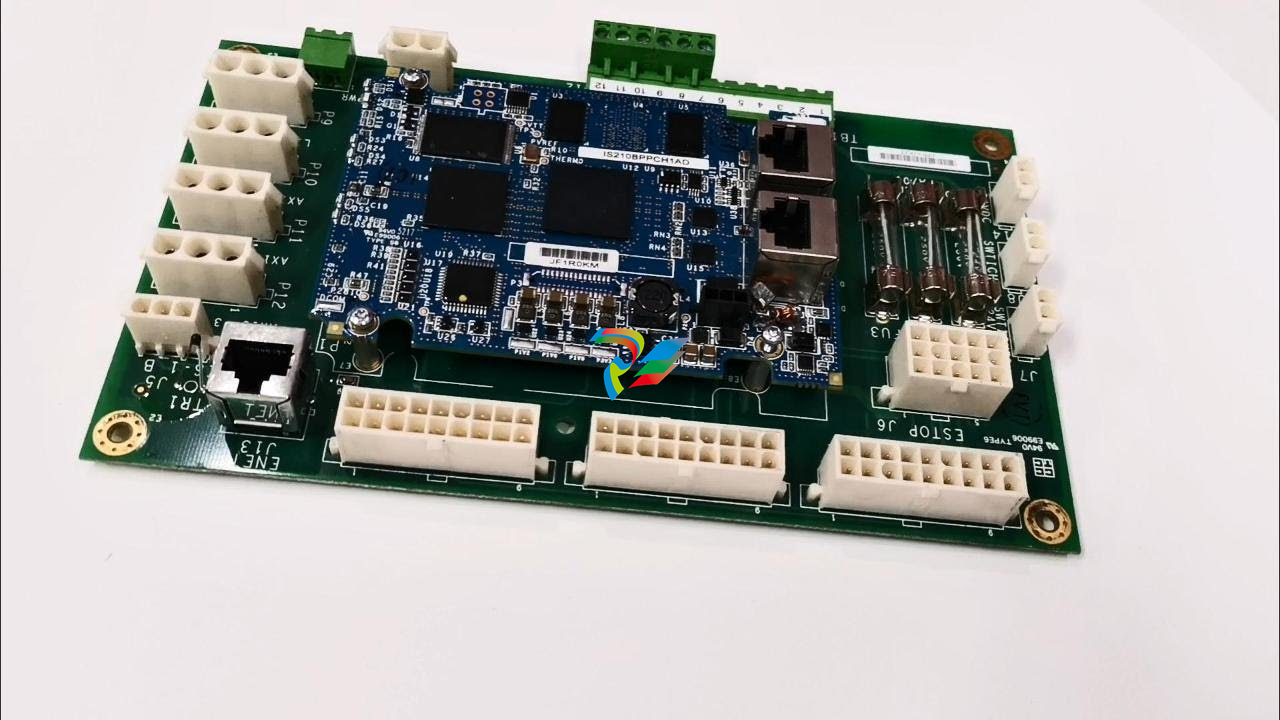 GE IS210BPPCH1A Mark VIe I/O Pack Processor Card
 -
 GE IS220PRTDH1A 336A4940CSP6 High-Performance RTD Input Module
 -
GE IS220PDIAH1BE 336A5026ADP4 Discrete Input Module
-
 GE IS420ESWBH3A IONET Switch Module
 -
 GE 516TX 336A4940DNP516TX 16-port Ethernet switch
 -
 GE EVMECNTM13 Embedded control module
 -
 GE EVPBDP0001 EVPBDP032 control module
 -
 GE Hydran M2-X Enhanced Monitoring with Extended Sensor Life
 -
 GE UR6CH Digital I/O Module
 -
 GE IC695CPU315-CD Central processing unit
 -
 GE 531X305NTBAMG1 DR Terminal Board
 -
 GE 531X305NTBALG1 NTB/3TB Terminal Board 531X Series
 -
 GE 531X305NTBAJG1 NTB/3TB Terminal Board.
 -
 GE 531X305NTBAHG1 NTB/3TB Terminal Board 531X
 -
 GE 531X305NTBAEG1 is a PCB that functions as a DR terminal board.
 -
General Electric 531X305NTBACG1 NTB/3TB Terminal Board 531X
-
 GE Digital Energy D20 Analog Input Module
 -
 GE 94-164136-001 main board Control board
 -
 GE 269 PLUS-D/O-100P-125V Digital motor relay
 -
 GALIL DMC-9940 High-performance motion controller
 -
 FUJI NP1BS-08 base plate
 -
 FUJI NP1Y32T09P1 Transistor drain type digital output module
 -
 FUJI NP1Y16R-08 Digital Output Module
 -
 FUJI NP1X3206-A High-speed digital input module
 -
 FUJI NP1AYH4I-MR current output module
 -
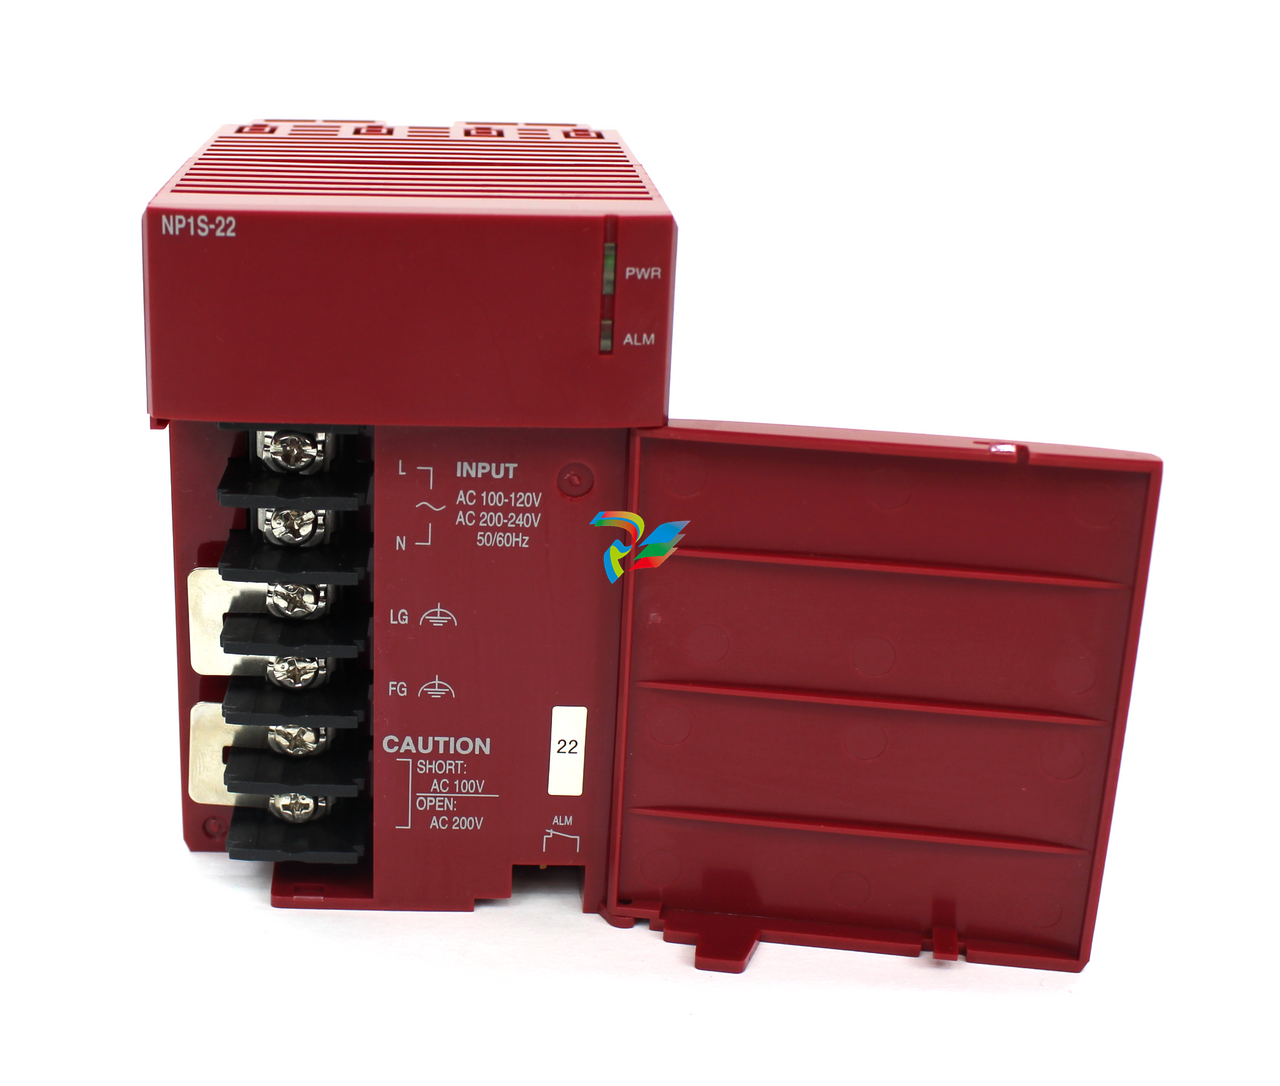 FUJI NP1S-22 Power module redundancy
 -
 FUJI RPXD2150-1T servo drive module
 -
 FUJI FVR008E7S-2UX Ac frequency converter
 -
 FUJI Ac frequency converter FVR008E7S-2
 -
 FUJI FVR004G5B-2 Small general-purpose frequency converter
 -
 FUJI A50L-2001-0232 Industrial control module
 -
 FUJI A50L-001-0266#N High-performance servo amplifier
 -
 Honeywell FS7-2173-2RP Gas sensor
 -
 Honeywell 10106/2/1 Digital Input Module in Stock
 -
 FRCE SYS68K CPU-40 B/16 PLC core processor module
 -
 Foxboro FBM I/O cards PBCO-D8-009
 -
 Foxboro AD916AE Digital Control System (DCS) Module
 -
 GE SR750-P5-G5-S5-HI-A20-R-E Multilin Relay
 -
.jpg) FOXBORO H90 H90C9AA0117S Industrial Computer Workstation
FOXBORO H90 H90C9AA0117S Industrial Computer Workstation -
.jpg) FOXBORO RH928AW | I/A Series Relay Output Module
FOXBORO RH928AW | I/A Series Relay Output Module -
.jpg) Foxboro N-2AX+DIO Multi-functional input/output module
Foxboro N-2AX+DIO Multi-functional input/output module -
 Foxboro RH924WA FCP280 Fiber Optic Network Adapter
 -
 FOXBORO H92 Versatile Hardware Component In
 -
 Foxboro FBM218 P0922VW HART® Communication Redundant Output Interface Module
 -
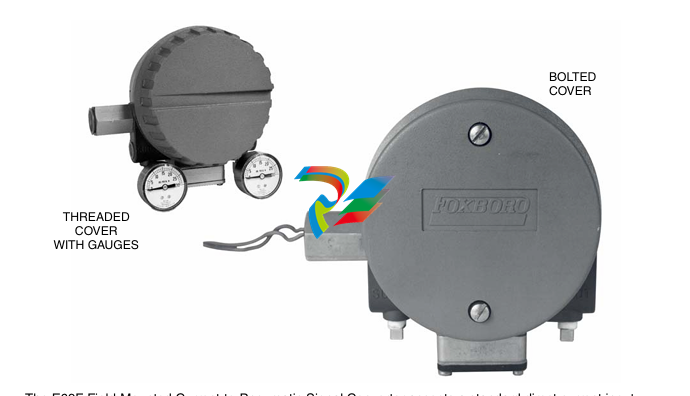
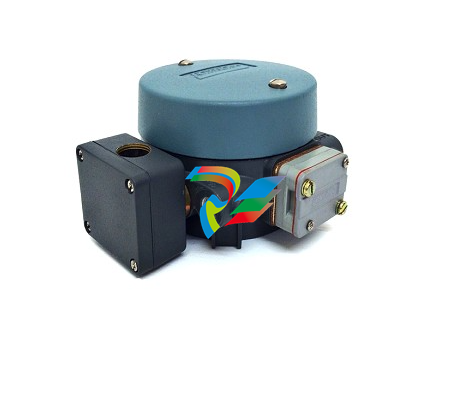 Foxboro E69F-TI2-J-R-S E69F Series Current-To-Pneumatic Signal Converter
 -
 Foxboro E69F-BI2-S Converter
 -
.jpg) Foxboro H92A049E0700 The host of the DCS control station
Foxboro H92A049E0700 The host of the DCS control station -
 Foxboro H90C9AA0117S Industrial computer workstation
 -
 Foxboro RH101AA High-performance industrial control module
 -
 Foxboro P0922YU FPS400-24 I/A Series Power supply
 -
.png) FOXBORO P0973LN Chassis-based managed switch with independent power supply
FOXBORO P0973LN Chassis-based managed switch with independent power supply -
.jpg) FOXBORO P0926PA Input/output module
FOXBORO P0926PA Input/output module -
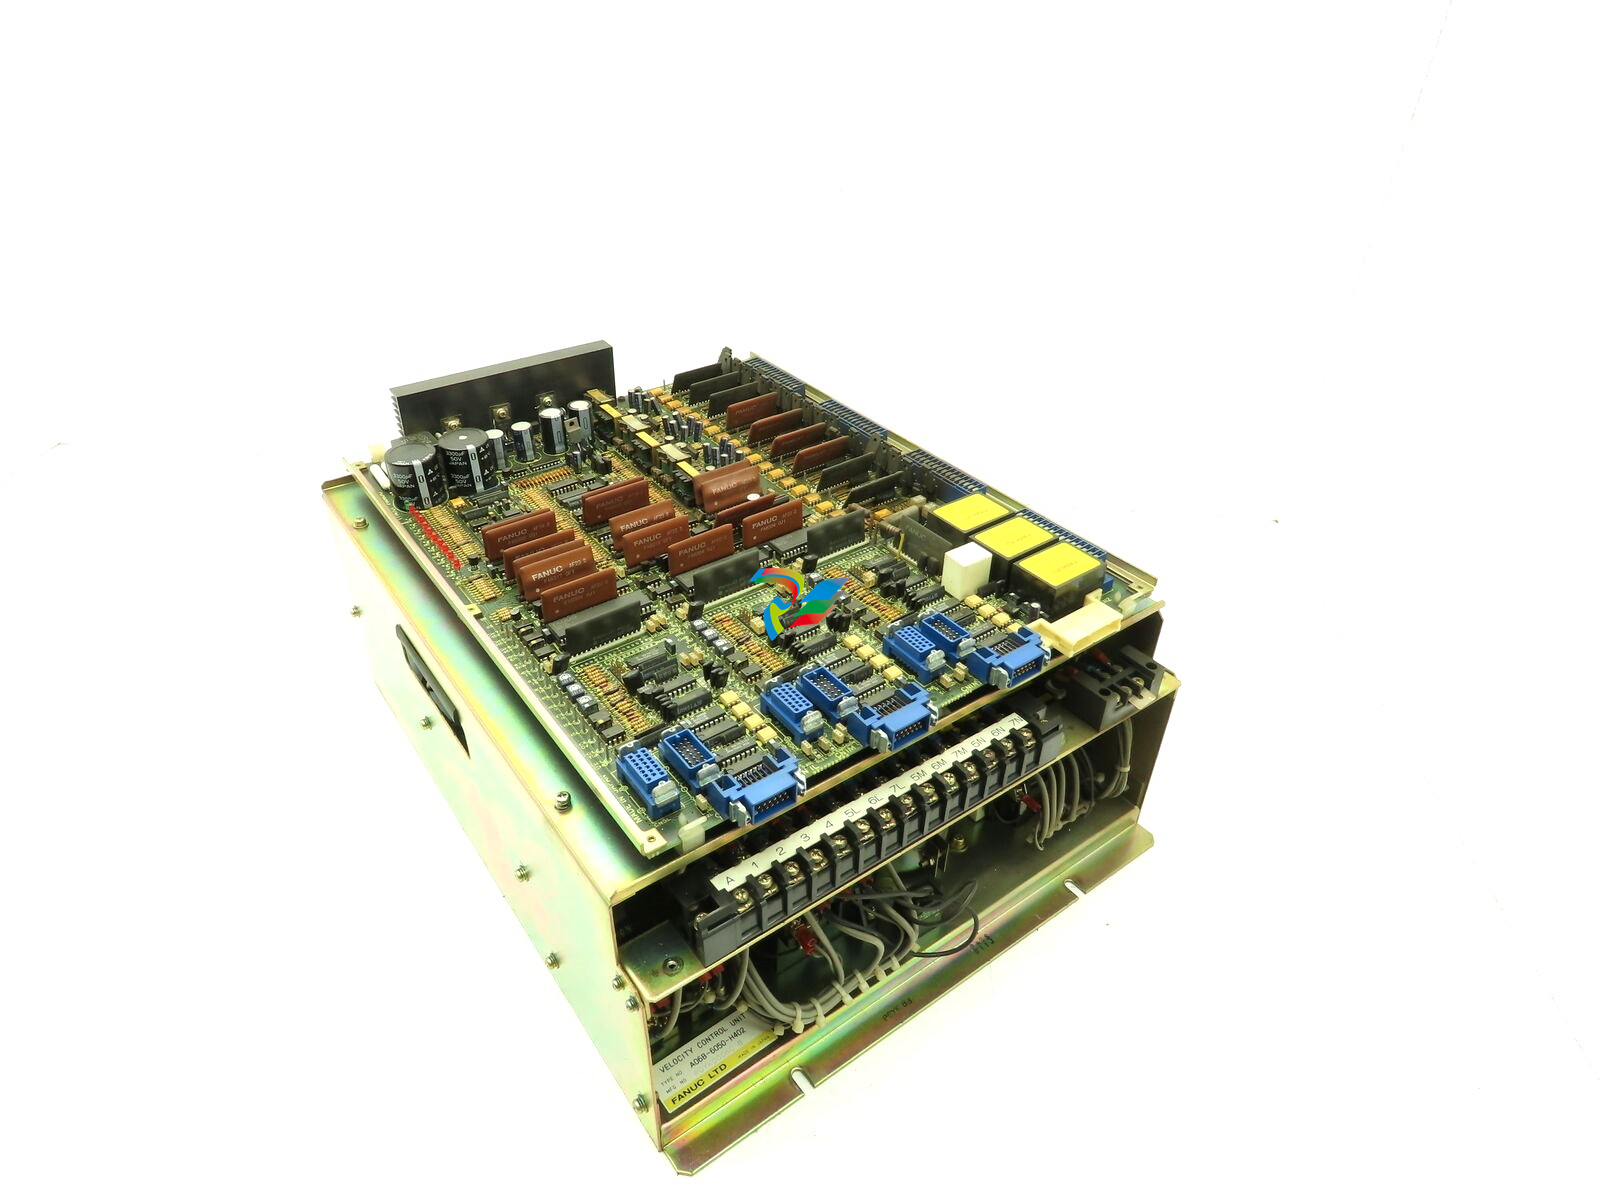 Fanuc A06B-6050-H402 3 AXIS ANALOG AC SERVO DRIVE
 -
.jpg) FOXBORO L0130AD L0130AE-0H Power module group
FOXBORO L0130AD L0130AE-0H Power module group -
_lVjBYb.jpg) FOXBORO 0399085B 0303440C+0303458A Combination Control Module
FOXBORO 0399085B 0303440C+0303458A Combination Control Module -
 FOXBORO SY-0399095E (SY-0303451D+SY-0303460E) Process control board
 -
.jpg) FOXBORO 0399071D 0303440C+0303443B Input/Output (I/O) Module
FOXBORO 0399071D 0303440C+0303443B Input/Output (I/O) Module -
.jpg) FOXBORO RH924UQ Redundant Controller module
FOXBORO RH924UQ Redundant Controller module -
 FFOXBORO E69F-TI2-S current pneumatic converter
 -
 FOXBORO FBM219 RH916RH Discrete I/O Module
 -
 FOXBORO FBM227 P0927AC Module
 -
.jpg) FOXBORO 0399144 SY-0301059F SY-1025115C/SY-1025120E I/O module
FOXBORO 0399144 SY-0301059F SY-1025115C/SY-1025120E I/O module -
.jpg) FOXBORO SY-60399001R SY-60301001RB Industrial Control Module
FOXBORO SY-60399001R SY-60301001RB Industrial Control Module -
 FOXBORO 0399143 SY-0301060R SY-1025115C SY-1025120E Combined control board
 -
 FOXBORO 873EC-JIPFGZ electrodeless conductivity analyzer
 -
 FOXBORO P0916PH (High-density HART I/O Module)
 -
 FOXBORO 870ITEC-AYFNZ-7 Intelligent Electrochemical Transmitters
 -
 FOXBORO Compact FBM240. Redundant with Readback, Discrete
 -
 FOXBORO FBM208/b, Redundant with Readback, 0 to 20 mA I/O Module
 -
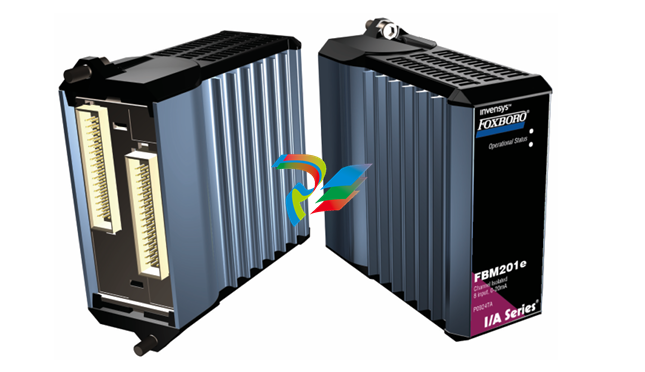 FOXBORO FBM201e Analog Input (0 to 20 mA) Interface Modules
 -
.jpg) FOXBORO P0916WG Terminal cable
FOXBORO P0916WG Terminal cable -
 FOXBORO P0926MX 2-Port Splitter
 -
.jpg) FOXBORO AD908JQ High-Frequency Module
FOXBORO AD908JQ High-Frequency Module -
.jpg) FOXBORO AD916CC Processor module
FOXBORO AD916CC Processor module -
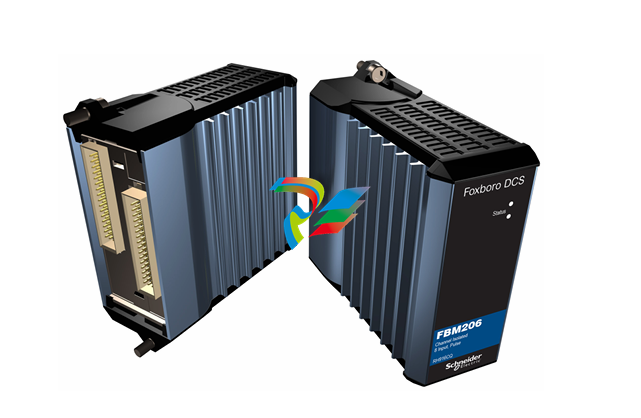 Foxboro DCS FBM206 Pulse Input Module
 -
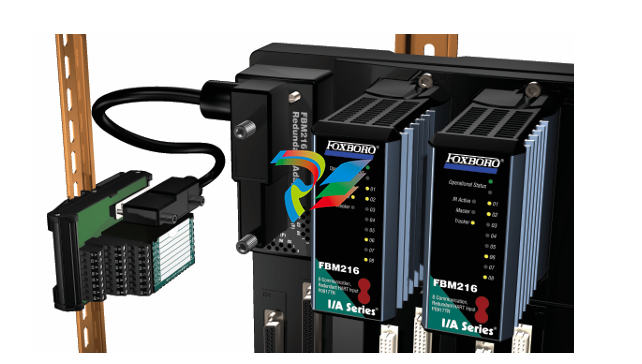 FOXBORO FBM216 HART® Communication Redundant Input Interface Module
 -
 Foxboro p0903nu 1×8 unit sub-component module
 -
 Foxboro P0911SM Industrial control module
 -
 Foxboro CM902WM I/O module
 -
 Foxboro CM902WL Power module
 -
 Foxboro P0972VA Industrial Control Module
 -
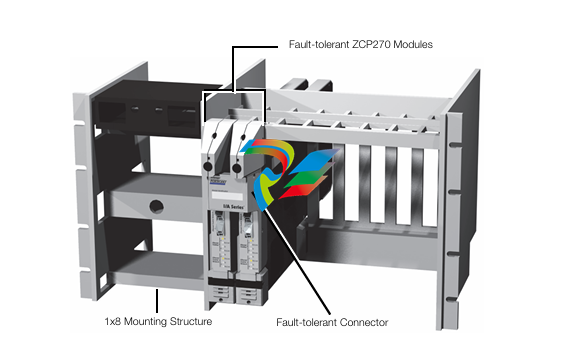
 Foxboro Z-Module Control Processor 270 (ZCP270)
 -
 Foxboro PO916JS 16-channel terminal block module
 -
 Foxboro PO911SM High-performance digital/analog input/output module
 -
 Foxboro P0972PP-NCNI Network Interface Module
 -
.jpg) FOXBORO P0971QZ controller module
FOXBORO P0971QZ controller module -
 FOXBORO P0971DP Thermal resistance input/output module
 -
 FOXBORO P0970VB Cable connector
 -
 FOXBORO P0970EJ-DNBX Dual-node bus expansion module
 -
 FOXBORO P0970BP Redundant power supply system
 -
.jpg) FOXBORO P0970BC-DNBI DeviceNet bus interface module
FOXBORO P0970BC-DNBI DeviceNet bus interface module -
.jpg) FOXBORO P0961FX-CP60S Main control CPU module
FOXBORO P0961FX-CP60S Main control CPU module -
.jpg) FOXBORO P0961EF-CP30B Network Interface Unit
FOXBORO P0961EF-CP30B Network Interface Unit -
.jpg) FOXBORO P0961CA Optical fiber local area network module
FOXBORO P0961CA Optical fiber local area network module -
.jpg) FOXBORO P0961BD-GW30B gateway processor module
FOXBORO P0961BD-GW30B gateway processor module -
.jpg) FOXBORO P0961BC-CP40B/I/A Series high-performance control processor module
FOXBORO P0961BC-CP40B/I/A Series high-performance control processor module -
FOXBORO P0960JA-CP40 High-performance control processor
-
FOXBORO P0926TM Control module
-
 FOXBORO P0916BX Termination Assembly
 -
.jpg) FOXBORO P0916AE P0916AG P0916AW Thermal resistance input type DCS card module
FOXBORO P0916AE P0916AG P0916AW Thermal resistance input type DCS card module -
 FOXBORO P0916AC FOXBORO distributed control system (DCS) compression terminal assembly
 -
.jpg) FOXBORO P0912CB High-performance interface module
FOXBORO P0912CB High-performance interface module -
.jpg) FOXBORO P0911VJ Thermal resistance input output module
FOXBORO P0911VJ Thermal resistance input output module -
.jpg) FOXBORO P0911QH-A High-precision module
FOXBORO P0911QH-A High-precision module -
 FOXBORO P0911QB-C P0911QC-C Thermal resistance input/output module
 -
 FOXBORO P0904BH P0904FH P0904HB Distributed Control system (DCS) module
 -
 FOXBORO P0903ZP P0903ZQ Embedded System Debugging Module
 -
 Foxboro P0903ZL P0903ZN Industrial power module
 -
 Foxboro P0903ZE I/A Series Fieldbus Isolator Module
 -
 FOXBORO P0903NW Industrial Control Module
 -
.jpg) FFOXBORO P0903NQ Industrial power module
FFOXBORO P0903NQ Industrial power module -
 FFOXBORO P0903AA Control Module
 -
 FOXBORO P0400DL Digital output module
 -
.jpg) FOXBORO P0400BJ Digital output module
FOXBORO P0400BJ Digital output module -
 FOXBORO GW30 industrial control module
 -
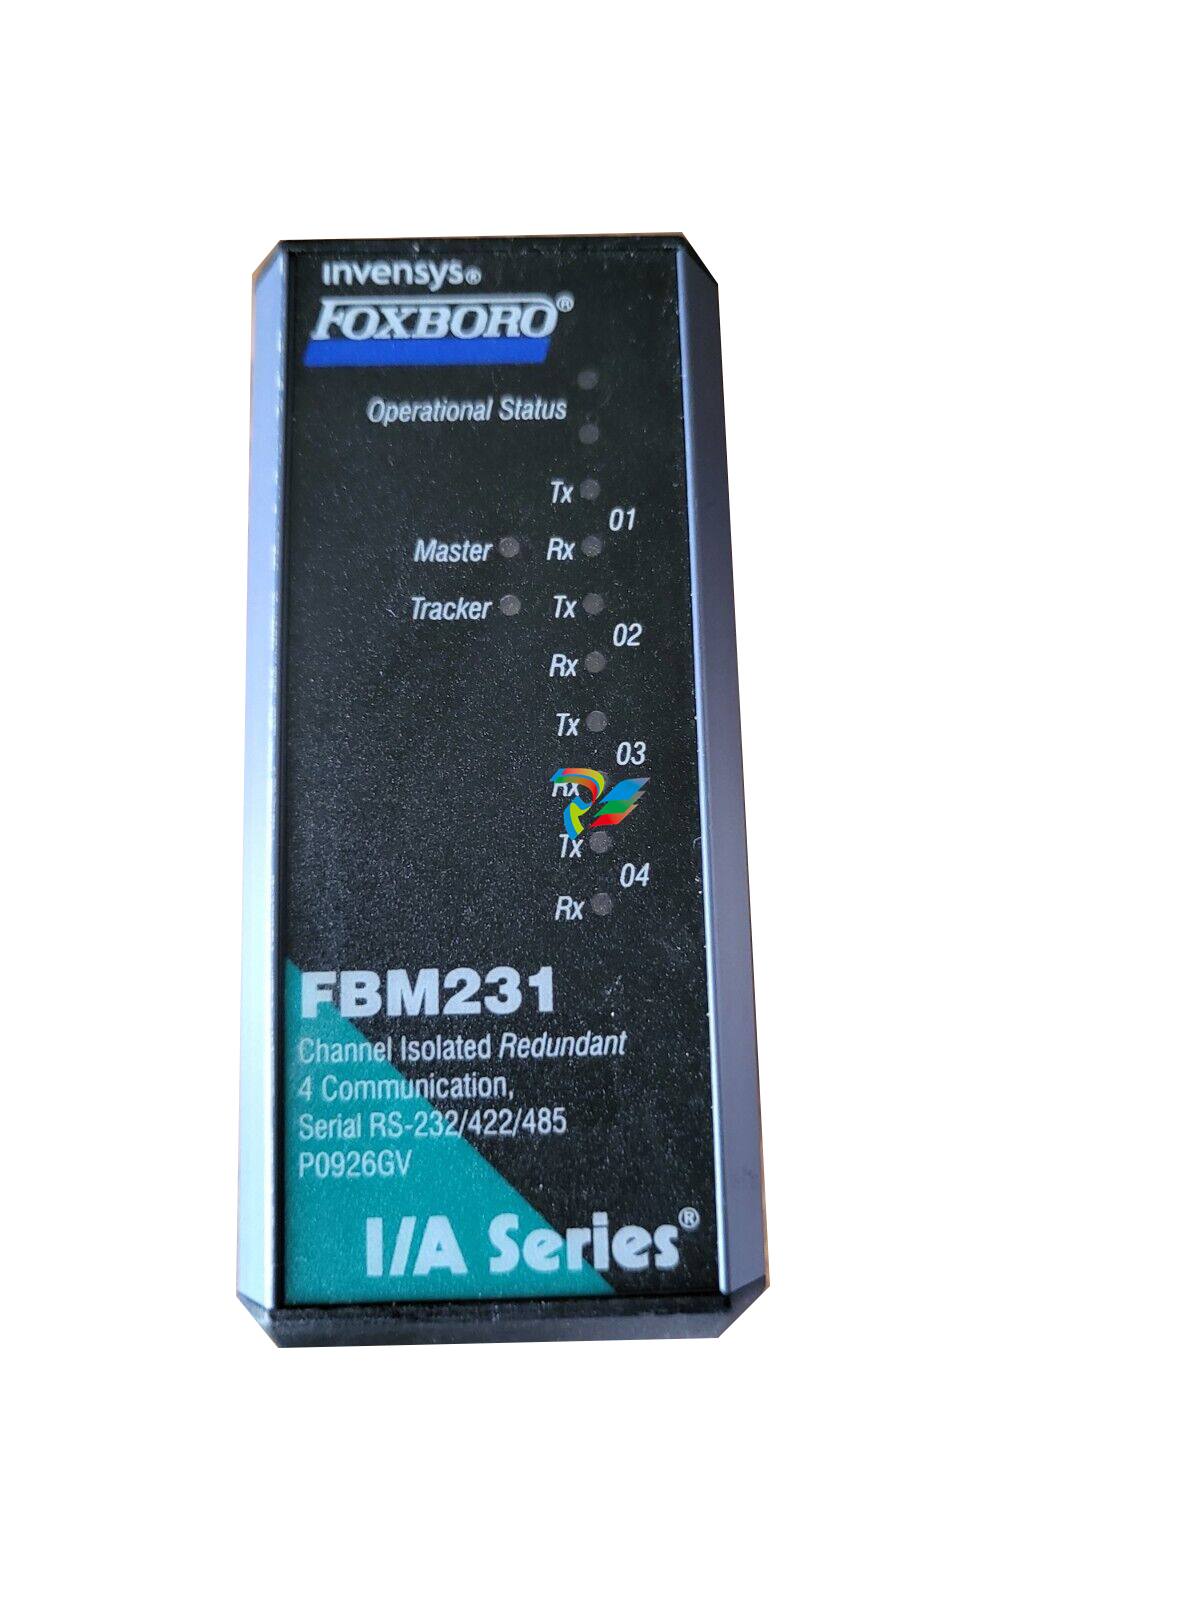 FOXBORO FBM231 Communication Output Module
 -
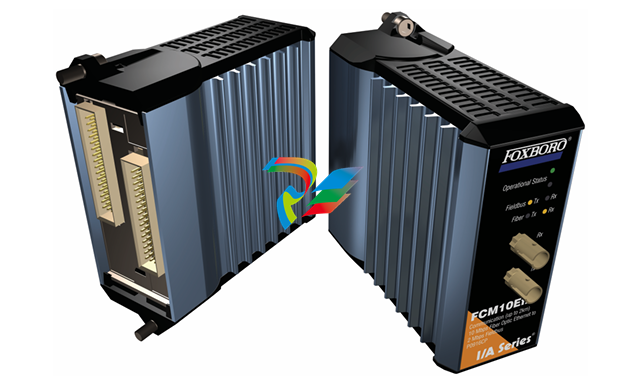 FOXBORO Fieldbus Communications Module, FCM10Ef
 -
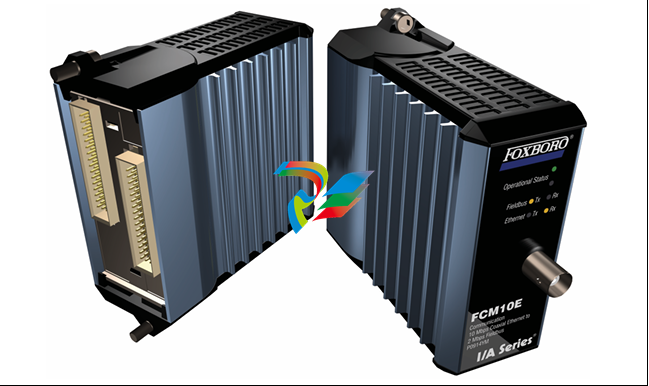 FOXBORO Fieldbus Communications Module, FCM10E