
Digitalization’s Influence on Maintenance Strategies

For example, retrospective analytics focus on historical degradation rates, the impacts of running different products or operating states, and the measurement of known failure modes. By contrast, futuristic—or proactive—analytics spotlight the likelihood of failures, prioritization of maintenance and other mitigating measures to reduce risk. Embedding these four types of analytics into daily operation leads to greater organizational analytics sophistication, and this act typically delivers quick return on investment by optimizing maintenance schedules and minimizing unplanned outages.
Many process manufacturers already possess a strong foundation in descriptive and diagnostic analytics, which are key building blocks for aspirational predictive and prescriptive analytics. By leveraging these fundamentals, engineers and data scientists equip themselves for the deep dive into high-value predictive and prescriptive analytics.
When it comes to maintenance planning and scheduling, combinations of retrospective and forward-facing analytics are needed to reach an optimal state. Knowing when components failed in the past, how and why they failed, and what was happening in the time periods surrounding these failures are all critical pieces of information required to predict future failures and prescribe effective mitigating actions.
Informing condition-based maintenance
Condition-based maintenance (CBM) was the idyllic maintenance strategy of the Lean Six Sigma age. The premise of CBM is that an event, trigger, or exceedance drives maintenance, rather than a schedule. The challenge with CBM was never in defining the condition that prompted a maintenance activity, because these conditions are often predefined by ancillary equipment constraints, like a maximum allowable temperature or pressure, or a minimum flow requirement. Rather, the challenge was in determining which limit would be exceeded, and when.
CBM is much more valuable when combined with model construction, marrying monitoring and forecasting techniques that together make up predictive analytics. For example, using near-real-time vibration data to do CBM on a fleet of pumps requires setting conservative triggers to effectively avoid running to failure in the time it takes to schedule and perform maintenance activities following detection. The downside of a conservative trigger is the inevitable presence of occasional false positives.
By contrast, when past and current vibration data is leveraged using a model, the model can construct a vibration forecast and compare it with historical runs in relation to other process signals. This better-informed prediction can approximate not only when a trigger will be hit, but when the failure is likely to occur, providing the greatest possible lead time for maintenance. In addition, these predictions can actively adjust over time, informing and updating the urgency of service based on how operation continues.
Digitalization-enhanced predictive analytics examples
Many manufacturers in the chemical and other process industries have transformed their operations by developing maintenance strategies built on the foundation of predictive analytics. As a result, these companies are minimizing downtime, unnecessary maintenance and operational uncertainty, saving millions of dollars every year. The most successful predictive analytics applications often combine first principles models with statistical techniques to develop forecasts based on theory and behavior.
Filtration membrane predictive maintenance
When producing certain biopharmaceutical compounds, the desired molecules are separated from other species using membrane filtration systems. During each batch, particles build up on the membrane, and a clean-in-place (CIP) procedure must remove the accumulation between batches. Over time, these filtration membranes can degrade, causing CIP procedures to become less effective.
Engineers at a major bioprocessor suspected this was the case with one of their operations. Fearing unplanned downtime, they sought a way to identify long-term particle buildup on the permeate filter to predict when maintenance was required.
Using an advanced analytics application, the manufacturer calculated the filter membrane resistance based on pressure and flow sensor data, and on known values of surface and fluid viscosity, by applying Darcy’s Law. This reduced the variables of interest, providing clear visual indicators of degrading membrane performance, confirming the engineers’ suspicions (Figure 2).

The team applied a linear regression algorithm to the data, effectively modeling the filtration degradation rate. This model was extrapolated into the future to build a predictive maintenance forecast and warning schedule, and maintenance activities are now proactively planned, maximizing the lifespan of filters and streamlining operations.
-
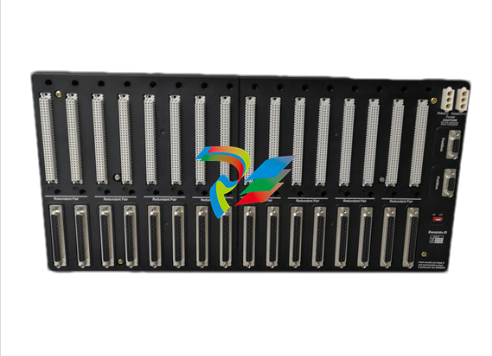
 IS200EPMCH1GE Mark VIe Patch Cord Power Distribution Card
 -
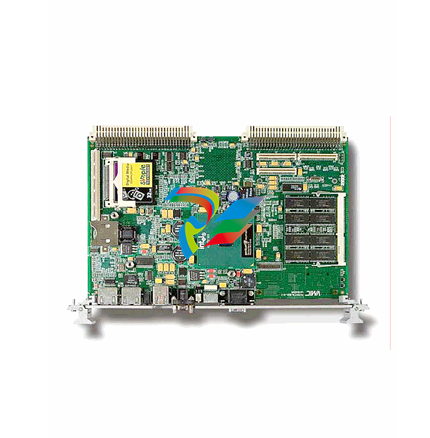
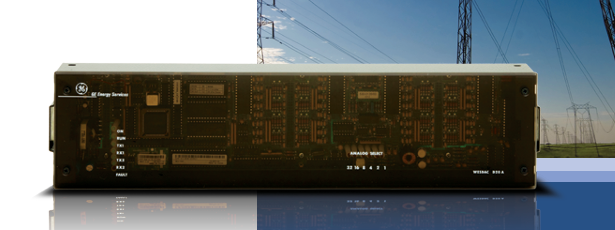
 VMICPCI-7632-03310 IS215UCCAH3A 350-657362-003310J GE gas turbine system control processor board
 -
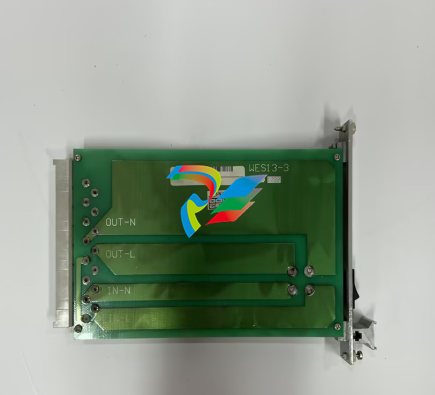 WEA13-13 2508-21001 Control Module / I/O Board
 -
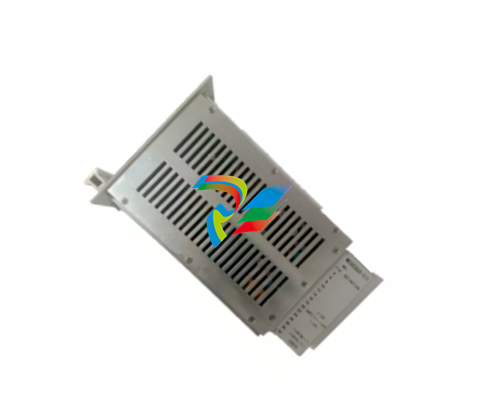
.jpg) WES5120 2340-21004 Controller Main Module
WES5120 2340-21004 Controller Main Module -
 WES5120 2340-21006 Field Controller Master Unit Module
 -
 WESDAC D20ME 18-MAR-13 Excitation Control Module
 -
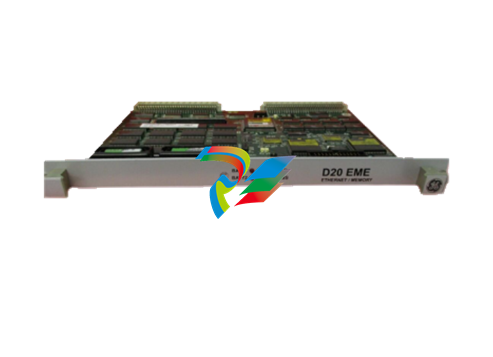
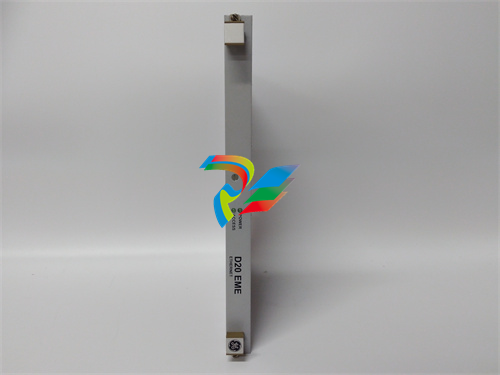 D20 EME 2400-21004 Ethernet communication and expansion module
 -
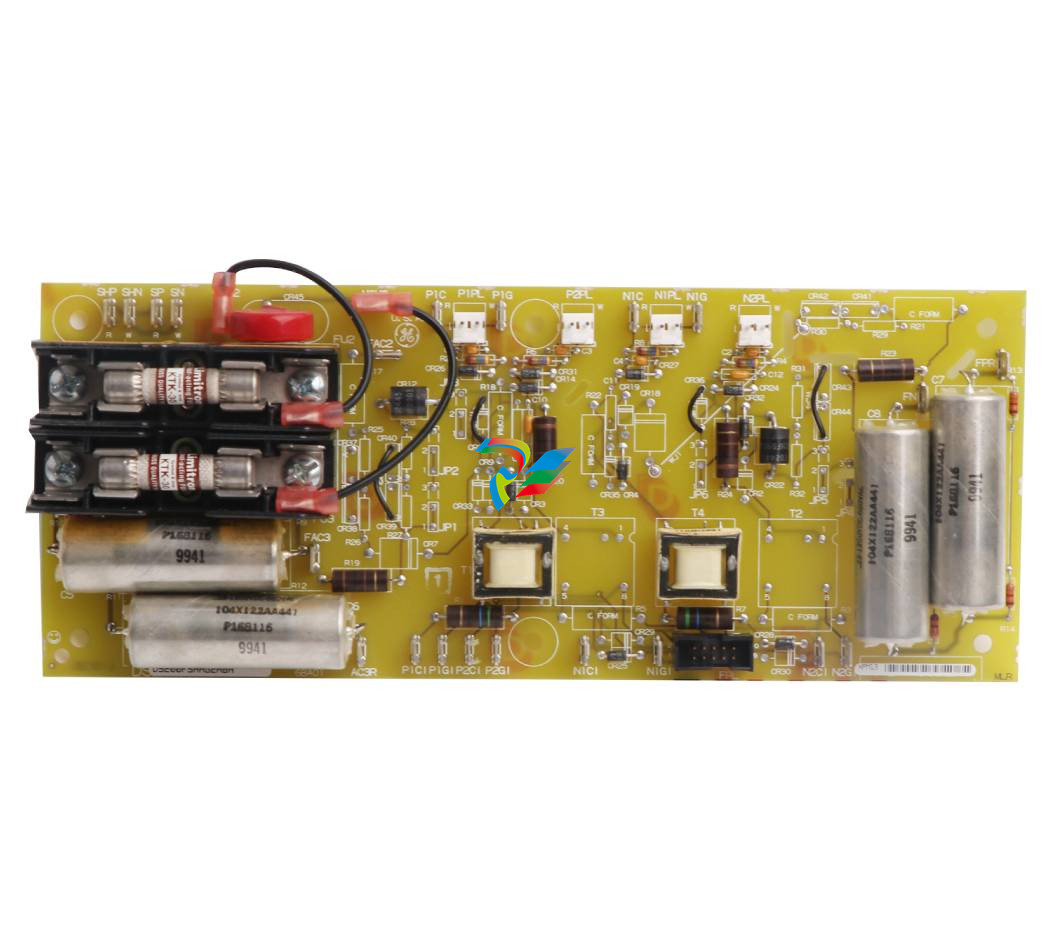
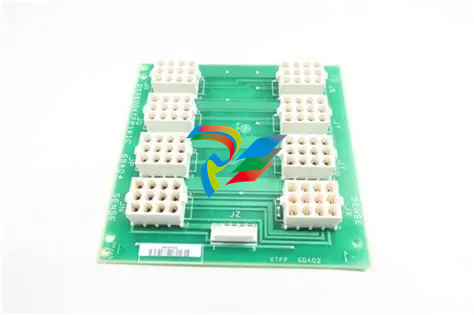 GE DS3800XTFP1E1C Thyristor Fan Out Board Brand
 -
 GE SR745-W2-P1-G1-HI-A-L-R-E Feeder protection relay
 -
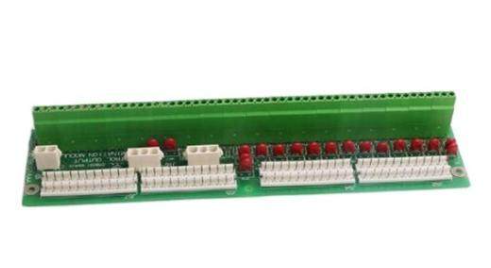
 GE IS230TNDSH2A Discrete Output Relay Module Brand
 -
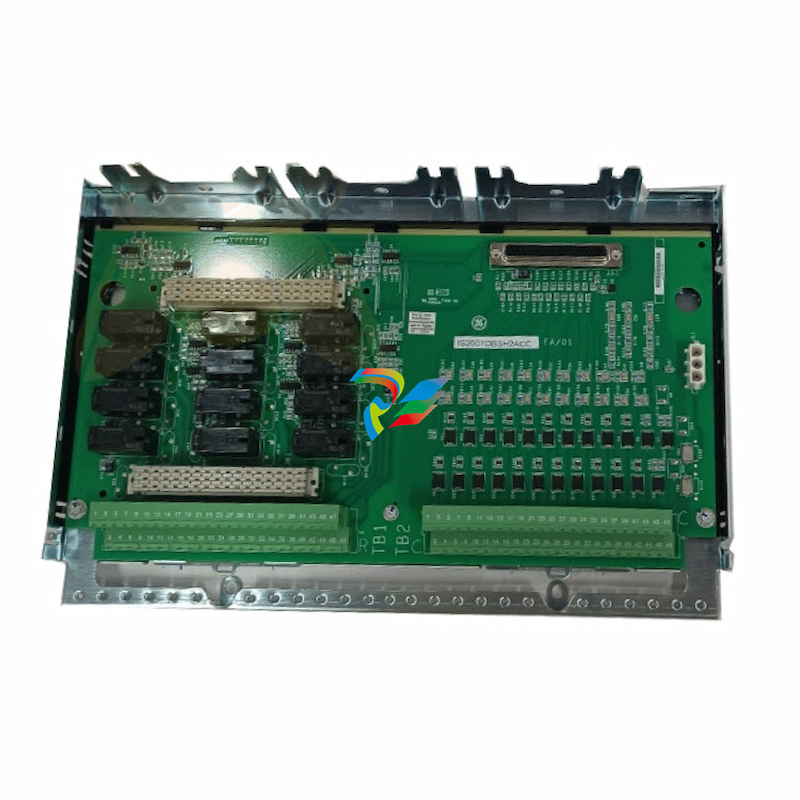 GE Fanuc IS200TDBSH2ACC Mark VI Terminal Board Brand
 -
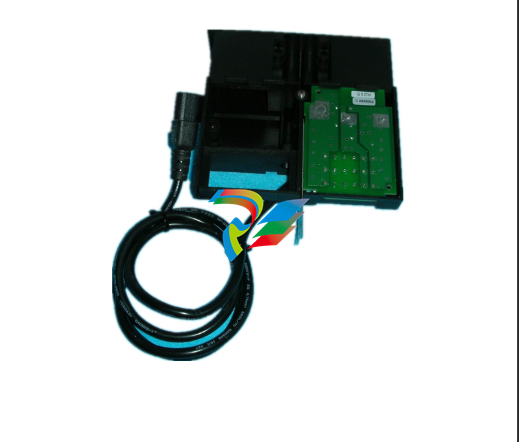
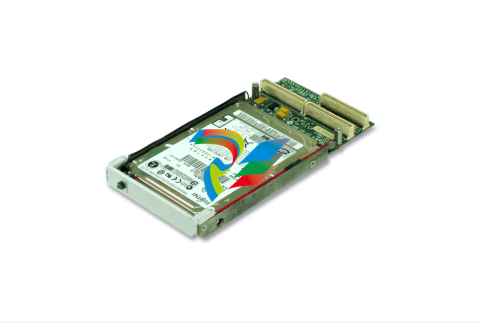 GE PMC-0247RC-282000 350-93750247-282000F Disk Drive
 -
GE PMC-0247RC-282000 350-93750247-282000F Disk Drive
-
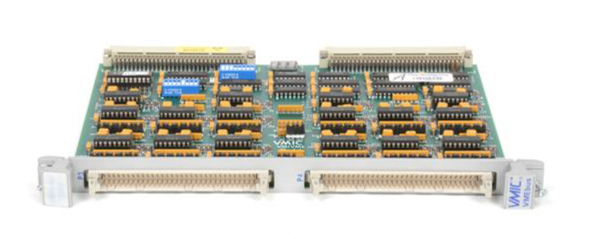 GE VMIVME-1150 Serial Communications Controller
 -
 GE VMIVME-5576 Fiber-Optic Reflective Memory with Interrupts
 -
 GE VMIC Isolated Digital Output VMIVME-2170A
 -
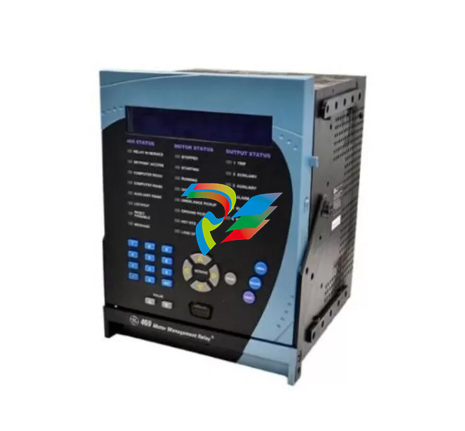
 GE MULTILIN 760 FEEDER MANAGEMENT RELAY 760-P5-G5-S5-HI-A20-R-E
 -
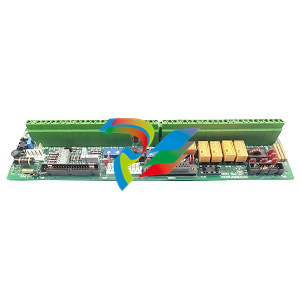
 GE IS200AEPAH1BKE IS215WEPAH2BB Printed circuit board
 -
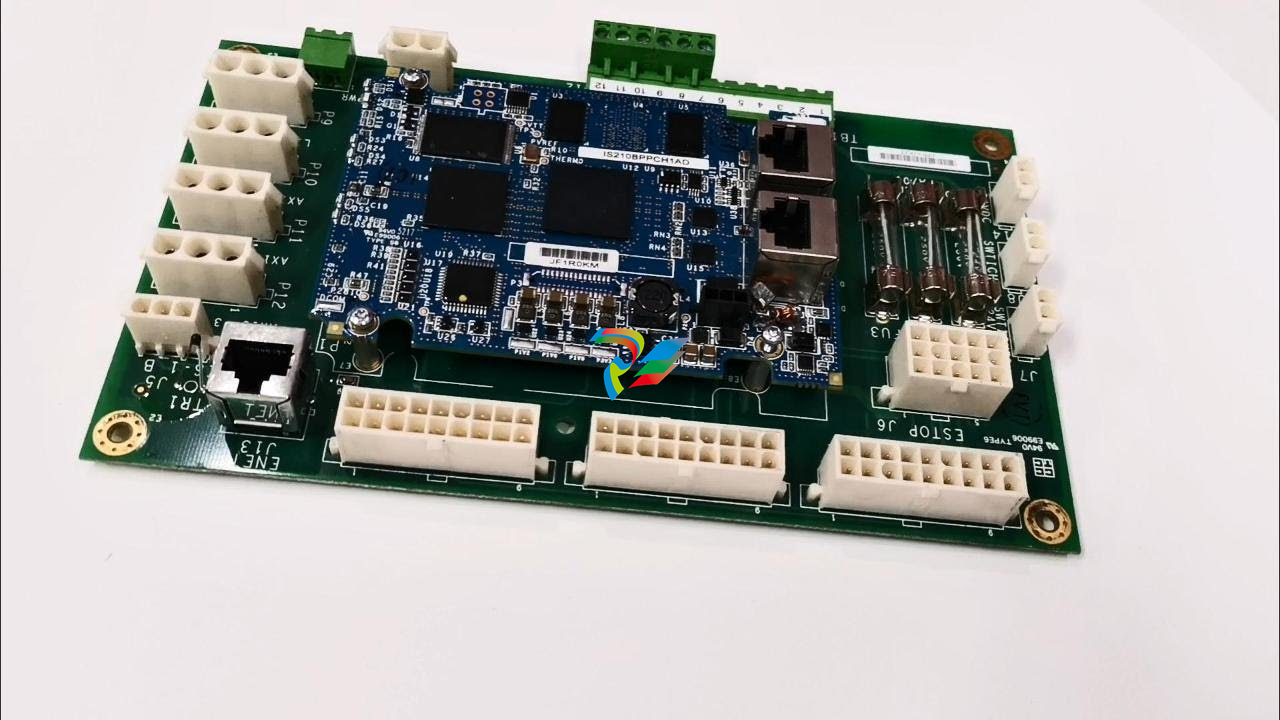 GE IS210BPPCH1A Mark VIe I/O Pack Processor Card
 -
 GE IS220PRTDH1A 336A4940CSP6 High-Performance RTD Input Module
 -
GE IS220PDIAH1BE 336A5026ADP4 Discrete Input Module
-
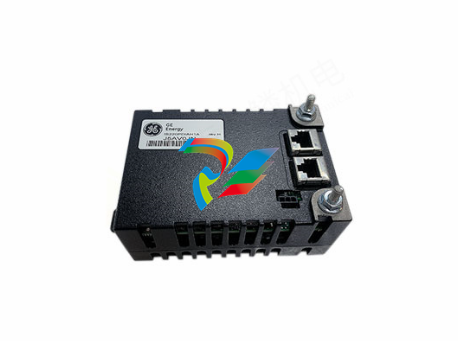
 GE IS420ESWBH3A IONET Switch Module
 -
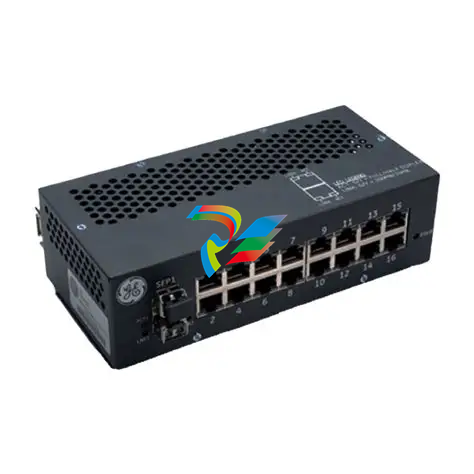
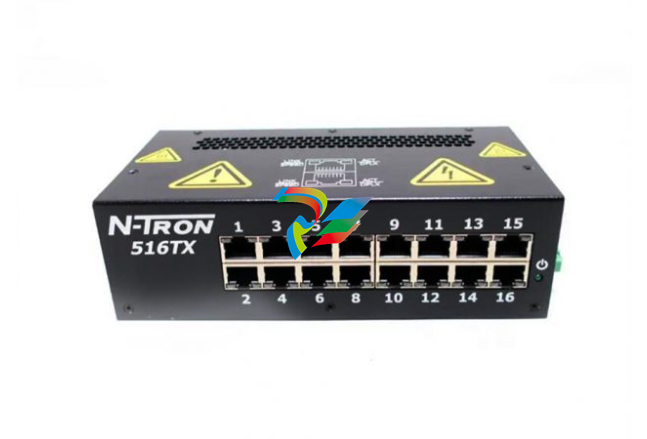 GE 516TX 336A4940DNP516TX 16-port Ethernet switch
 -
 GE EVMECNTM13 Embedded control module
 -
GE EVPBDP0001 EVPBDP032 control module
-
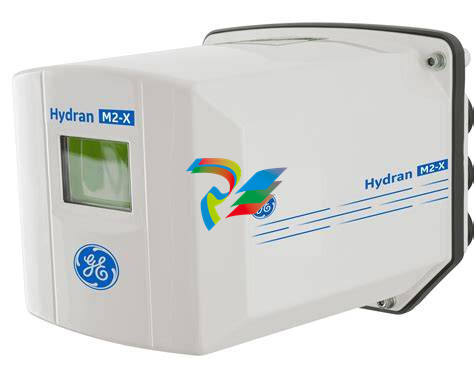 GE Hydran M2-X Enhanced Monitoring with Extended Sensor Life
 -
 GE UR6CH Digital I/O Module
 -
 GE IC695CPU315-CD Central processing unit
 -
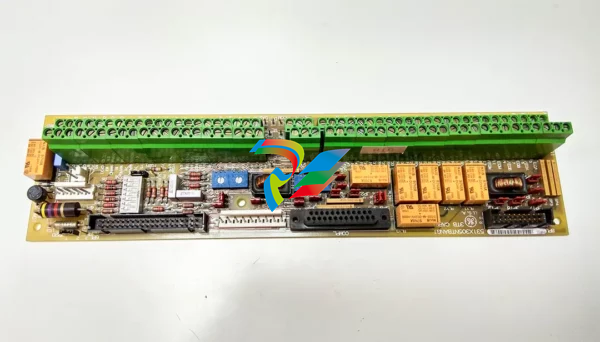
 GE 531X305NTBAMG1 DR Terminal Board
 -
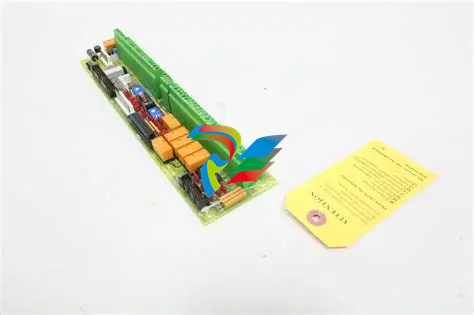
 GE 531X305NTBALG1 NTB/3TB Terminal Board 531X Series
 -
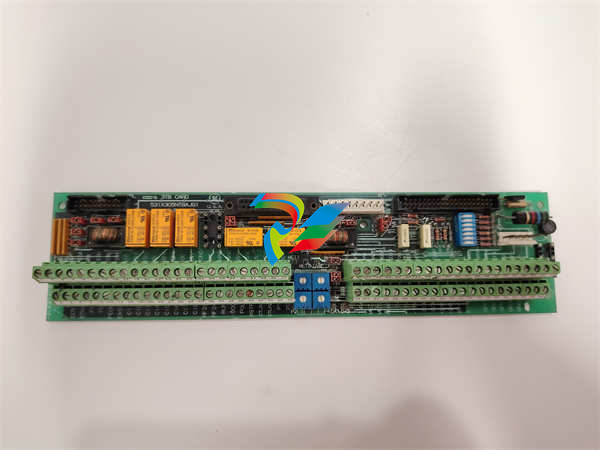 GE 531X305NTBAJG1 NTB/3TB Terminal Board.
 -
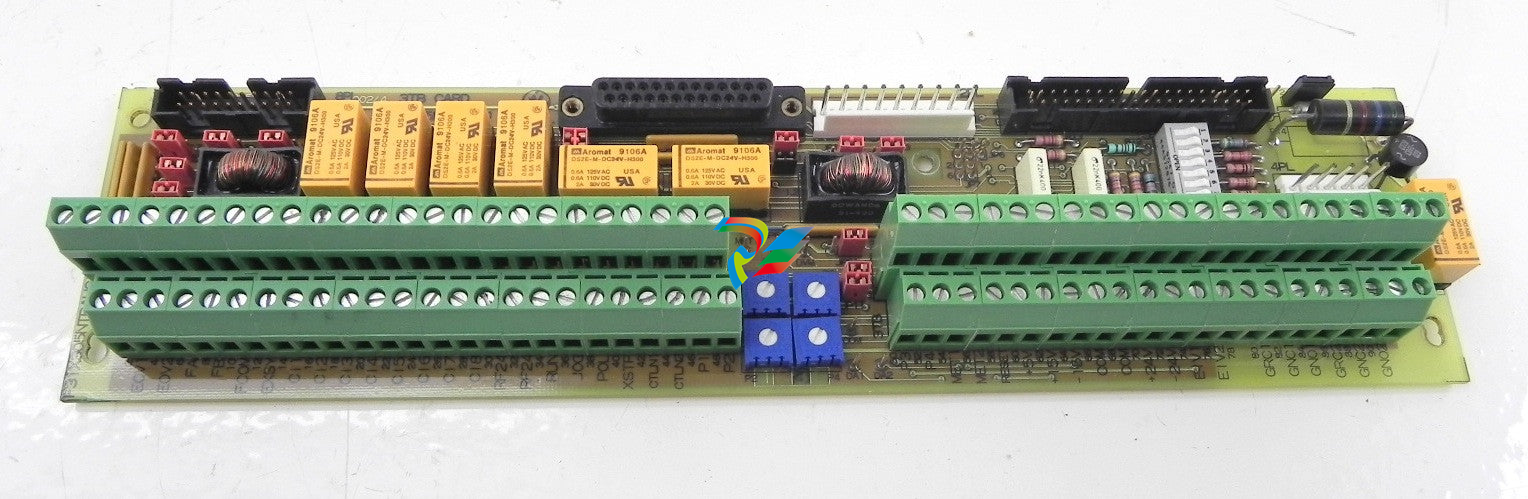 GE 531X305NTBAHG1 NTB/3TB Terminal Board 531X
 -
 GE 531X305NTBAEG1 is a PCB that functions as a DR terminal board.
 -
General Electric 531X305NTBACG1 NTB/3TB Terminal Board 531X
-
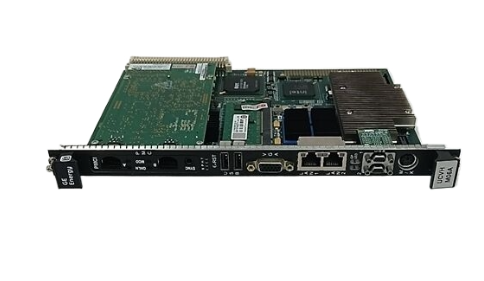
 GE Digital Energy D20 Analog Input Module
 -
 GE 94-164136-001 main board Control board
 -
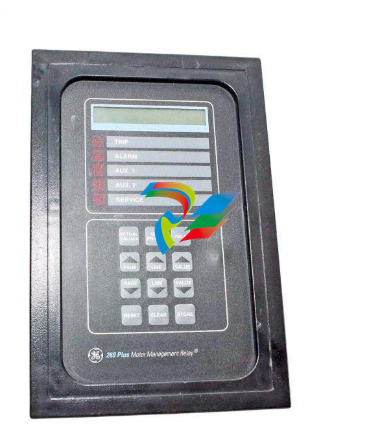 GE 269 PLUS-D/O-100P-125V Digital motor relay
 -
 GALIL DMC-9940 High-performance motion controller
 -
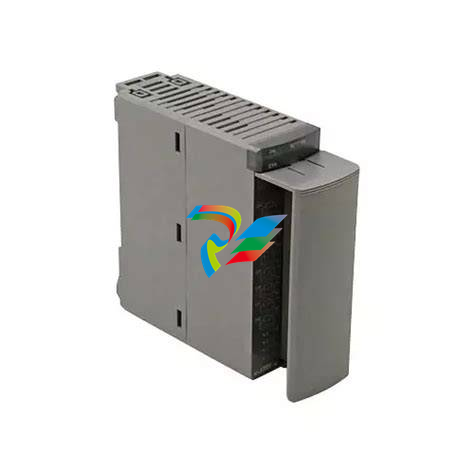
 FUJI NP1BS-08 base plate
 -
 FUJI NP1Y32T09P1 Transistor drain type digital output module
 -
 FUJI NP1Y16R-08 Digital Output Module
 -
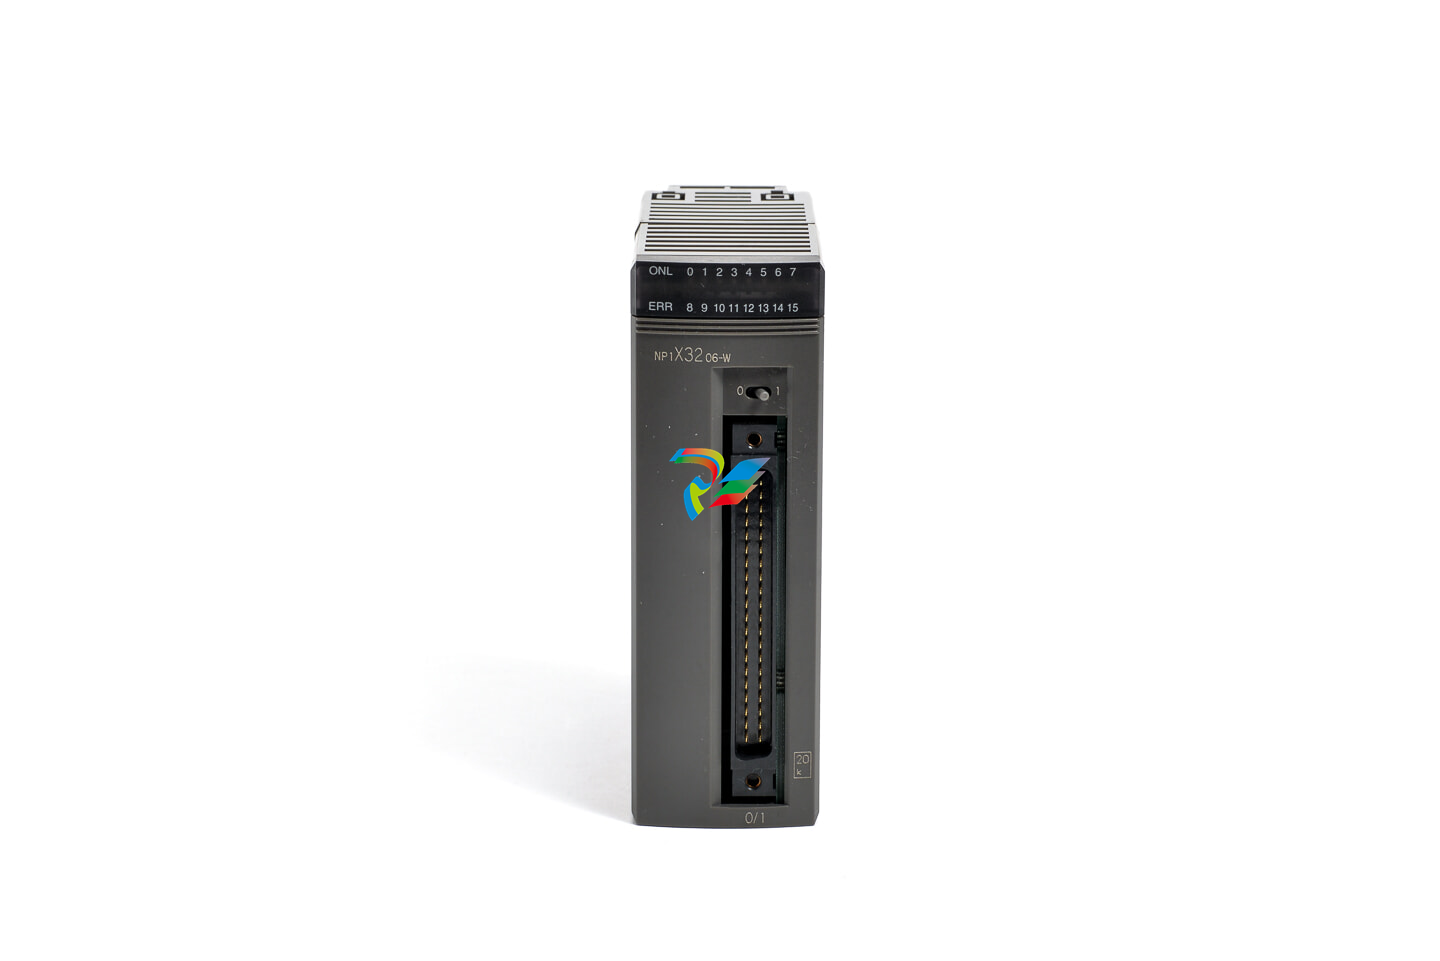 FUJI NP1X3206-A High-speed digital input module
 -
 FUJI NP1AYH4I-MR current output module
 -
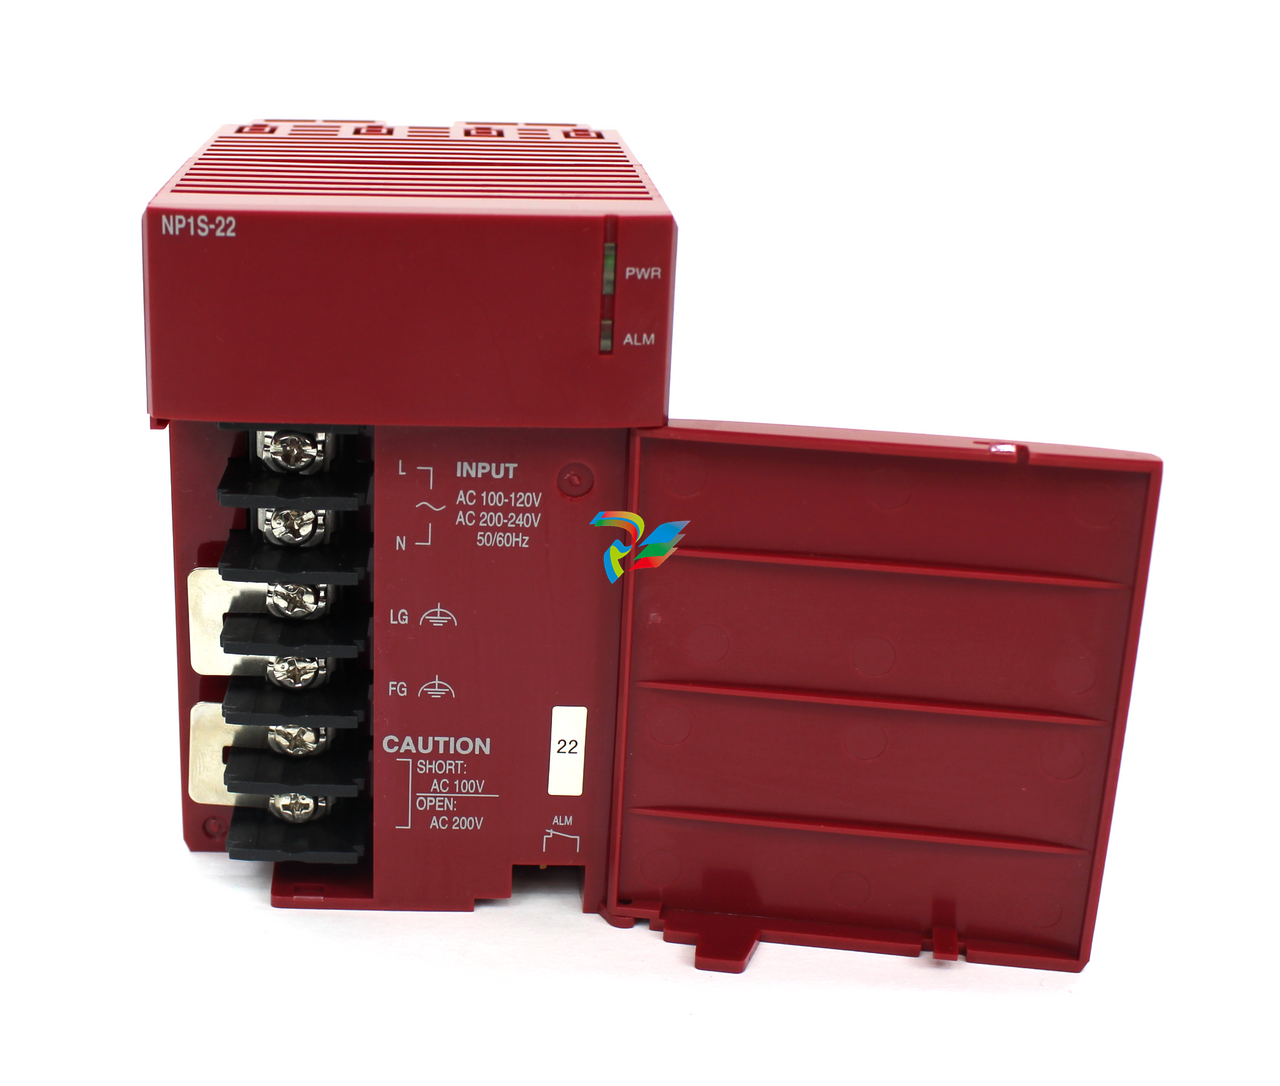 FUJI NP1S-22 Power module redundancy
 -
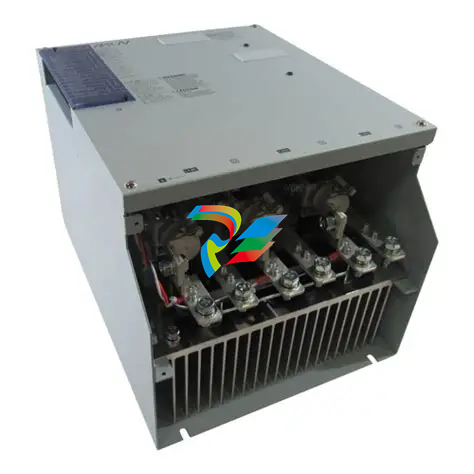 FUJI RPXD2150-1T servo drive module
 -
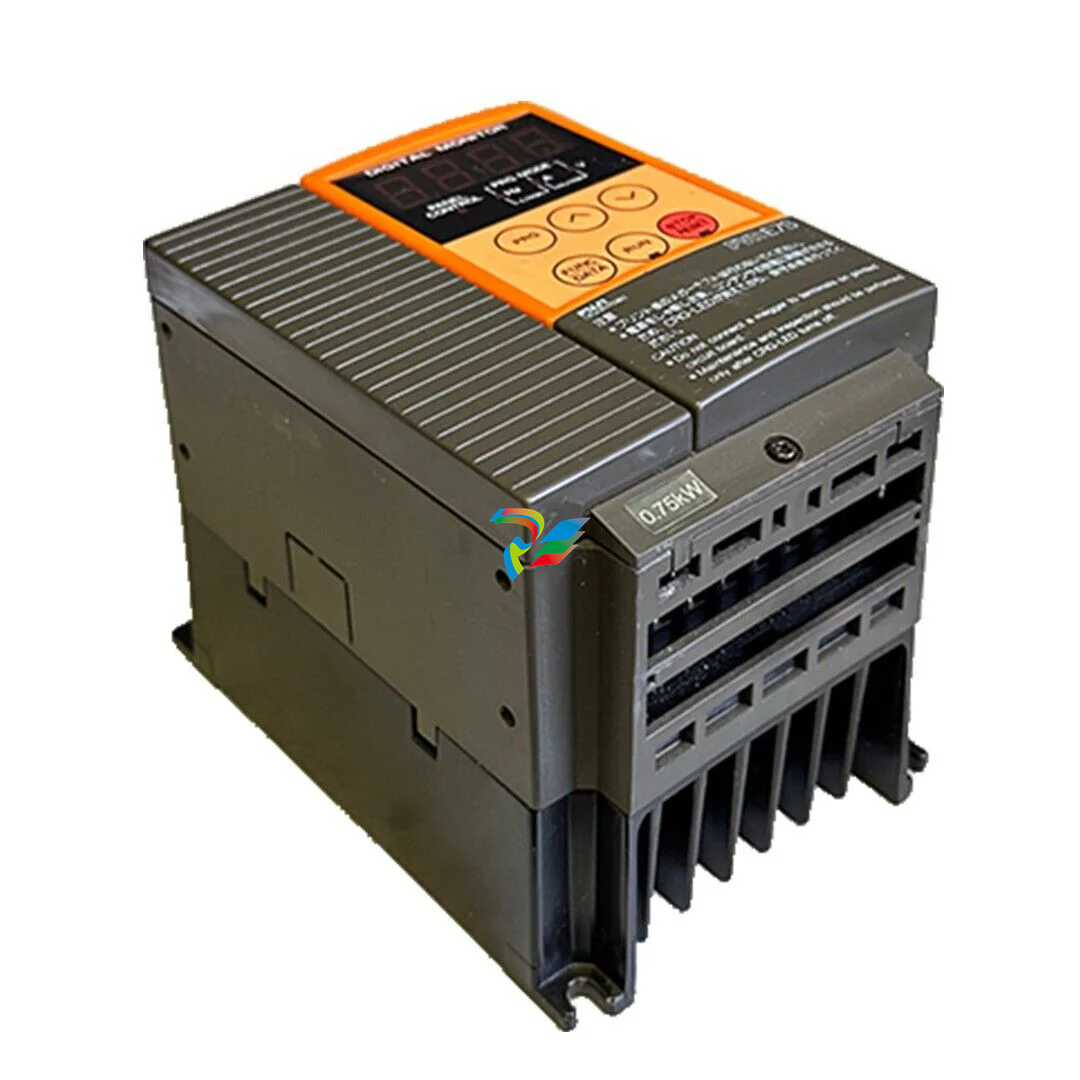
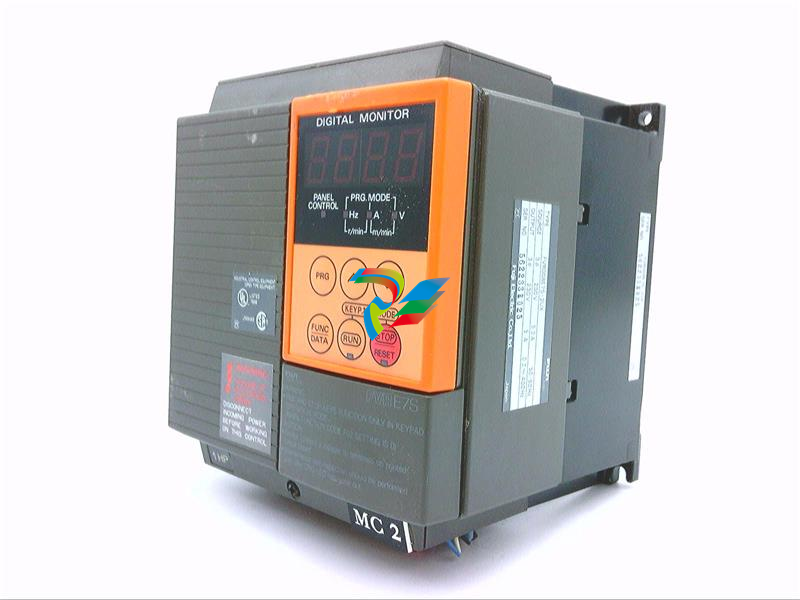 FUJI FVR008E7S-2UX Ac frequency converter
 -
 FUJI Ac frequency converter FVR008E7S-2
 -
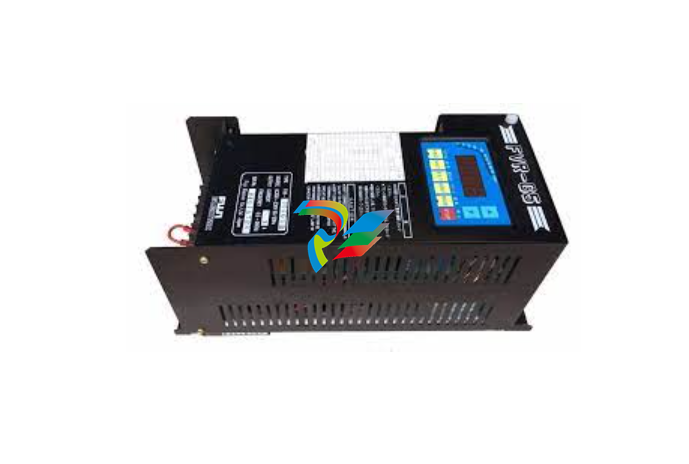 FUJI FVR004G5B-2 Small general-purpose frequency converter
 -
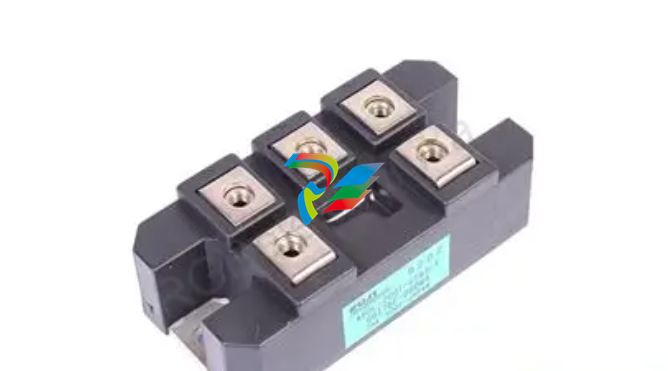 FUJI A50L-2001-0232 Industrial control module
 -
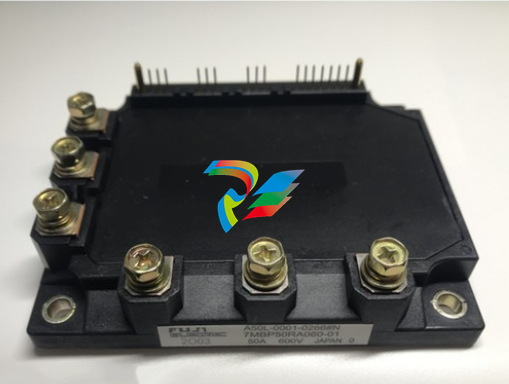 FUJI A50L-001-0266#N High-performance servo amplifier
 -
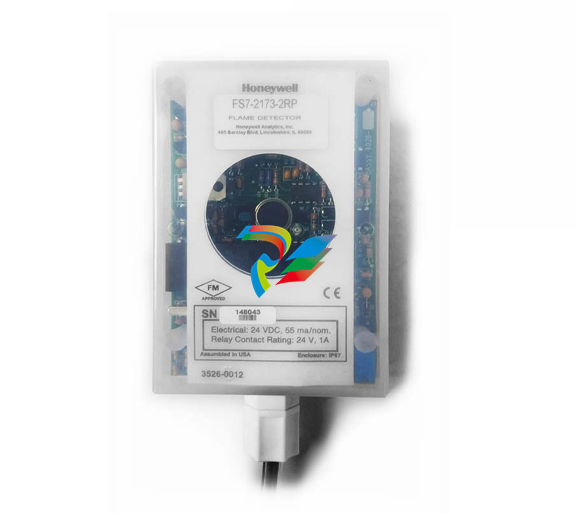 Honeywell FS7-2173-2RP Gas sensor
 -
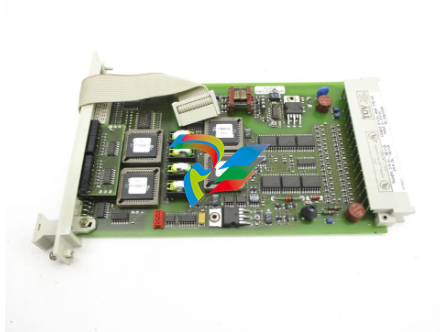 Honeywell 10106/2/1 Digital Input Module in Stock
 -
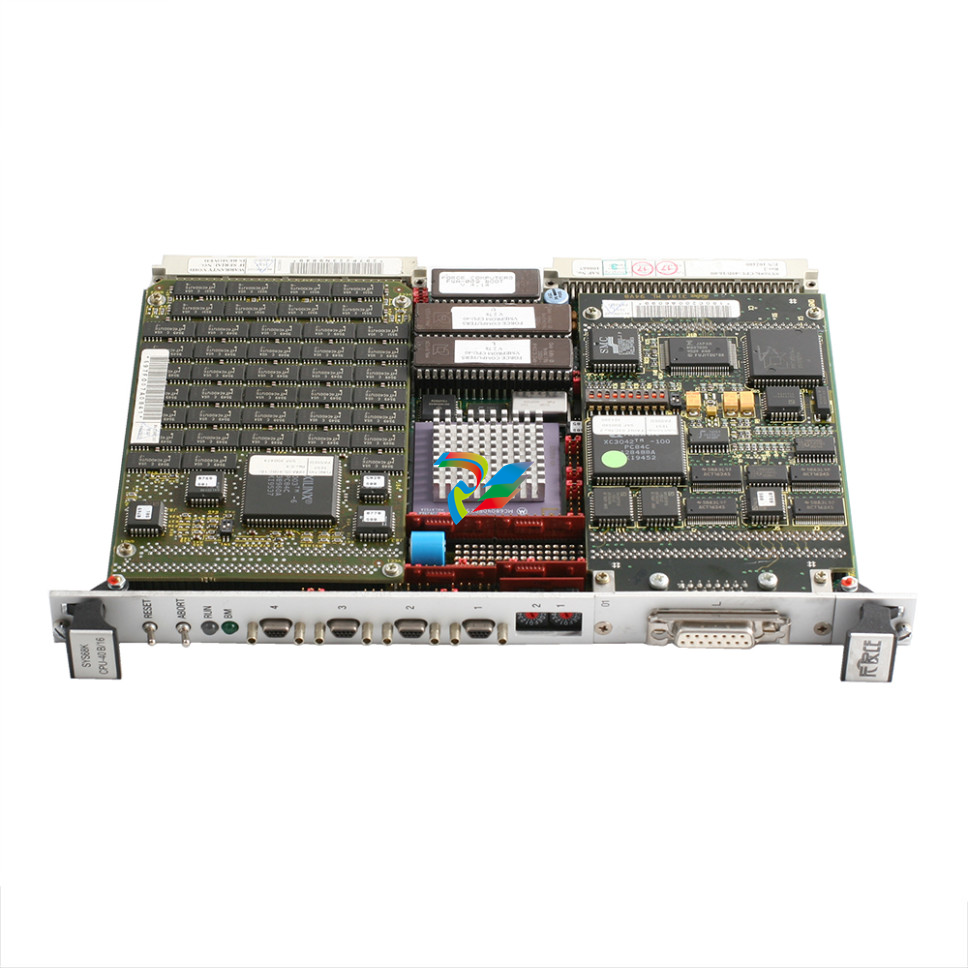 FRCE SYS68K CPU-40 B/16 PLC core processor module
 -
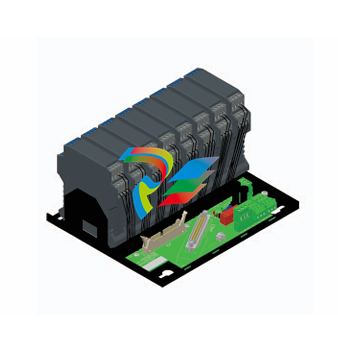 Foxboro FBM I/O cards PBCO-D8-009
 -
 Foxboro AD916AE Digital Control System (DCS) Module
 -
 GE SR750-P5-G5-S5-HI-A20-R-E Multilin Relay
 -
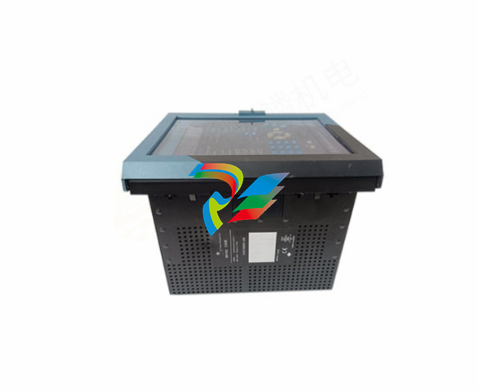
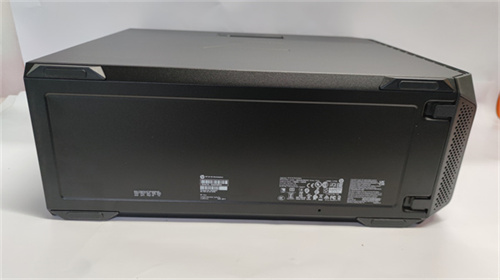
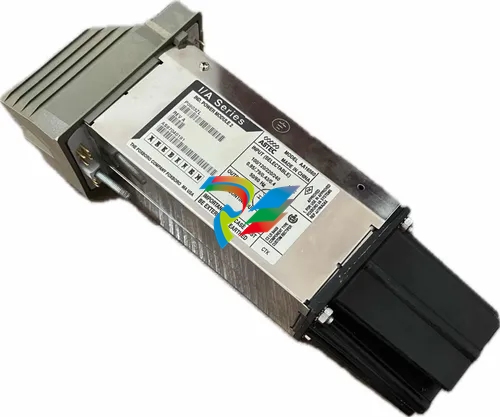
.jpg) FOXBORO H90 H90C9AA0117S Industrial Computer Workstation
FOXBORO H90 H90C9AA0117S Industrial Computer Workstation -
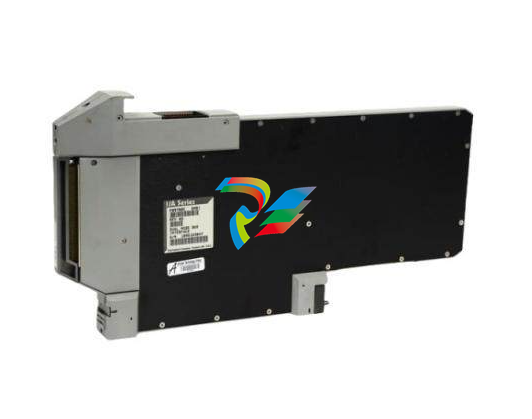
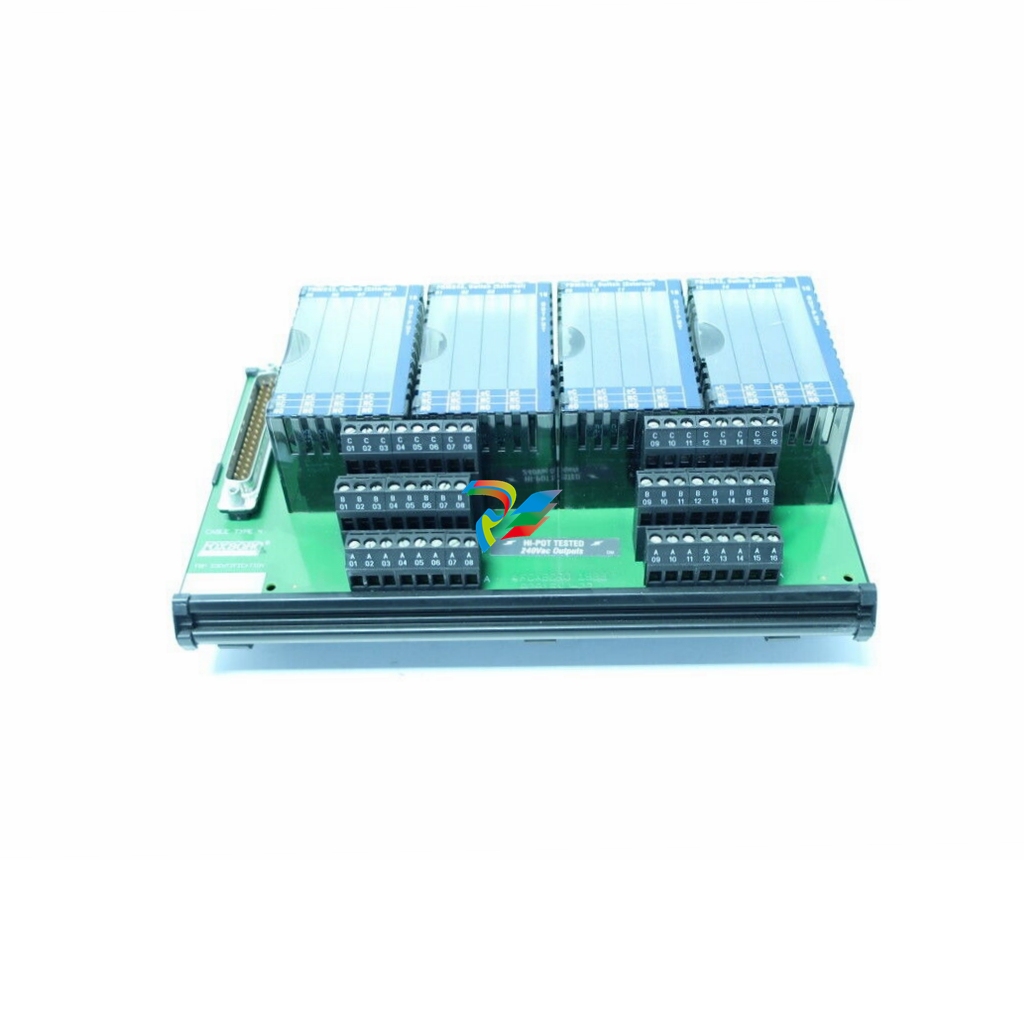
FOXBORO RH928AW | I/A Series Relay Output Module
-
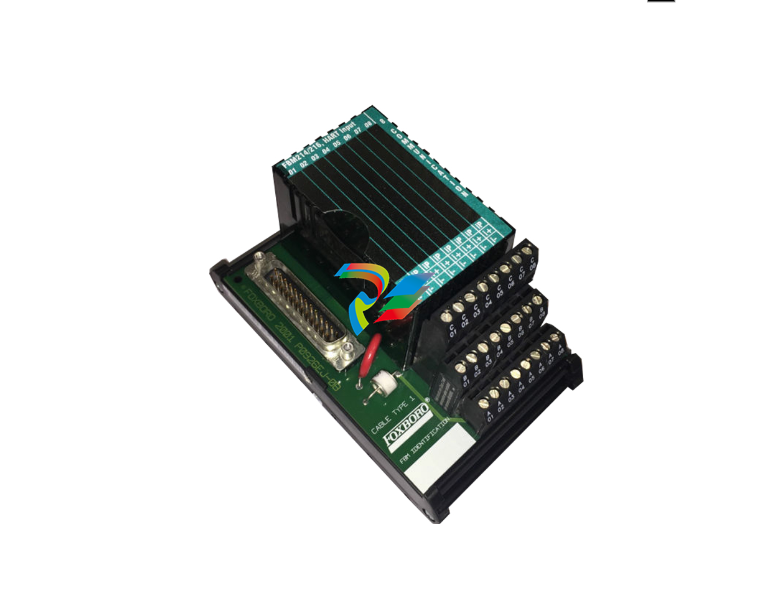
.jpg) Foxboro N-2AX+DIO Multi-functional input/output module
Foxboro N-2AX+DIO Multi-functional input/output module -
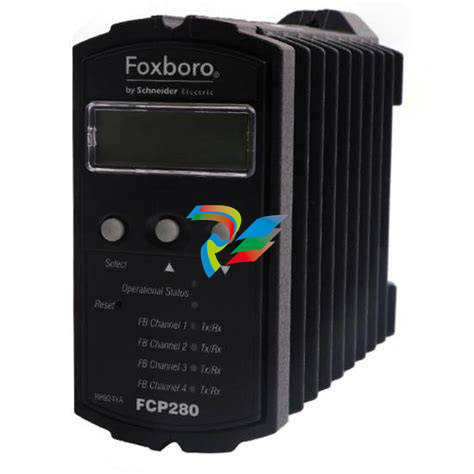 Foxboro RH924WA FCP280 Fiber Optic Network Adapter
 -
 FOXBORO H92 Versatile Hardware Component In
 -
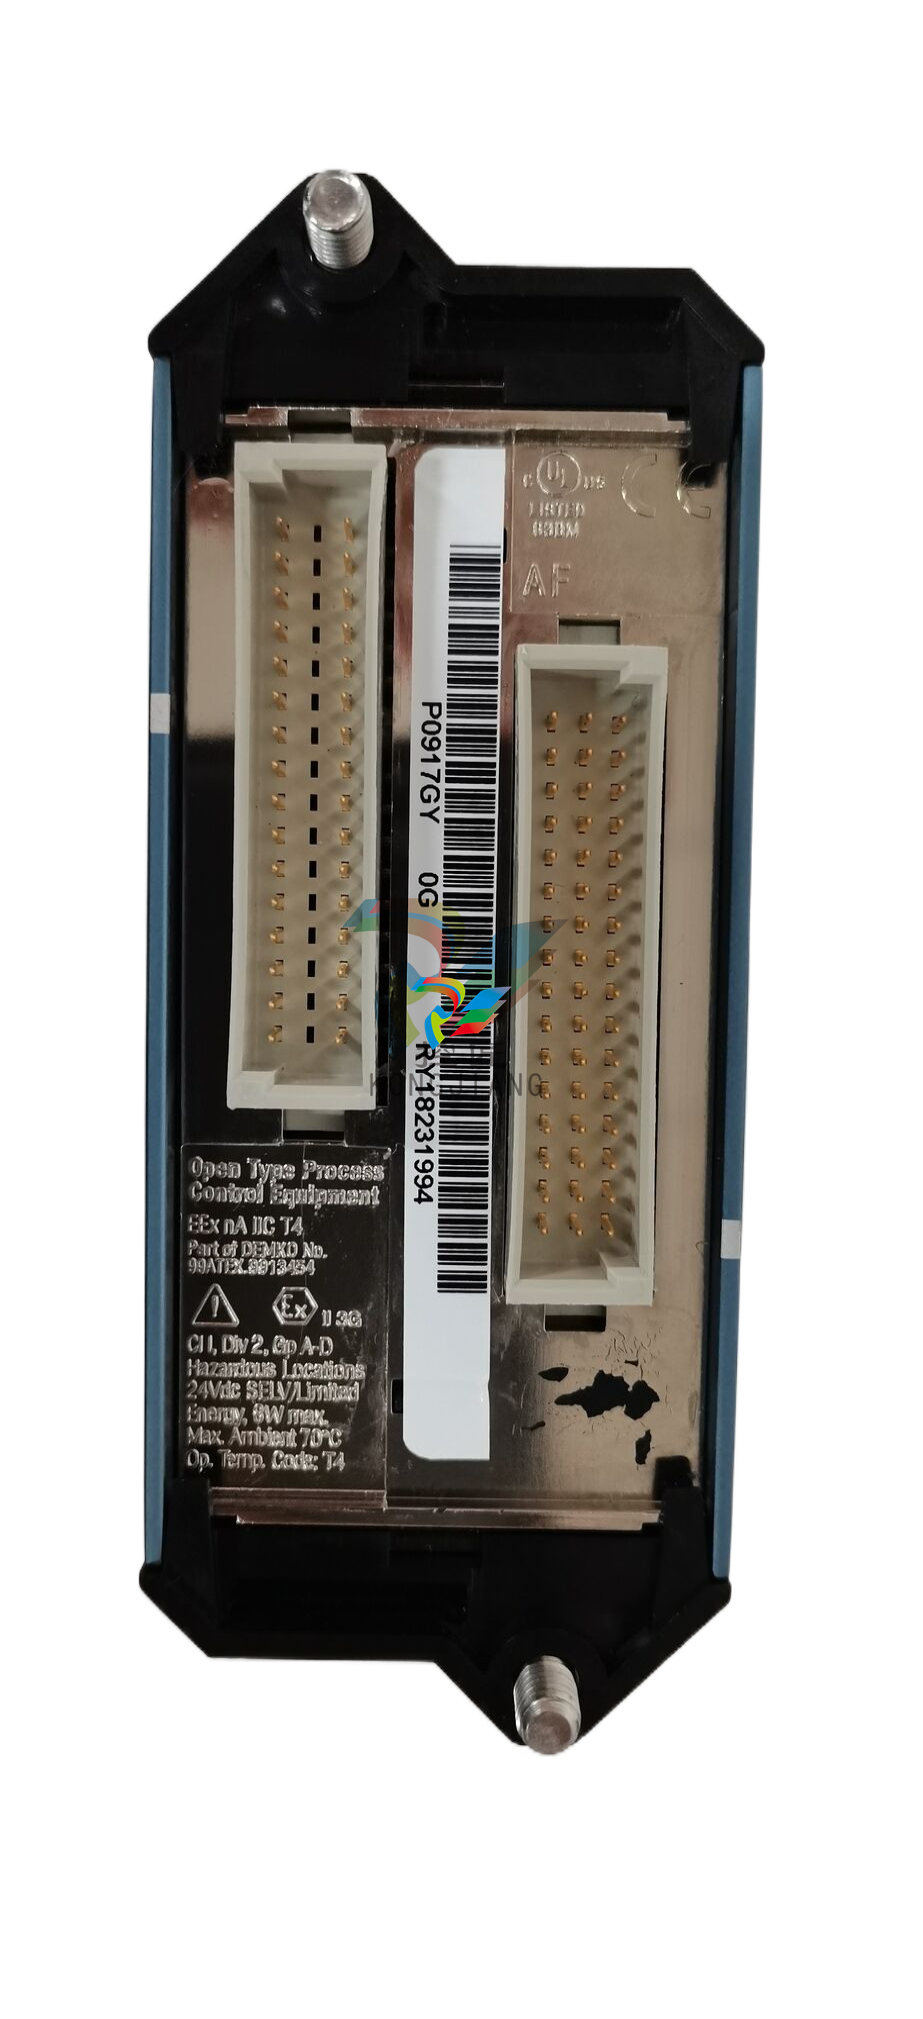
 Foxboro FBM218 P0922VW HART® Communication Redundant Output Interface Module
 -
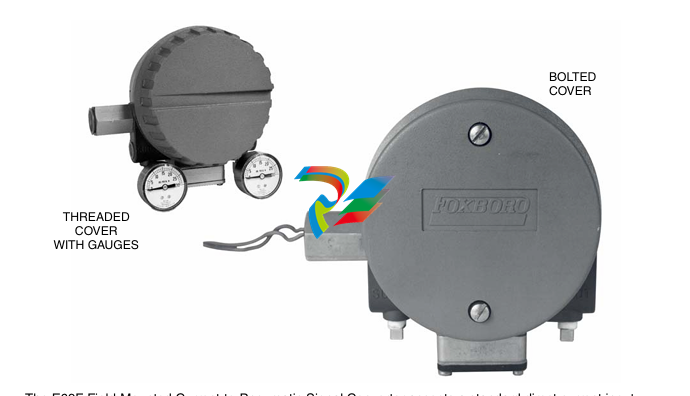
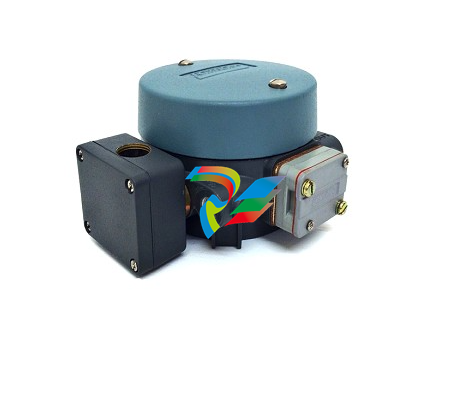 Foxboro E69F-TI2-J-R-S E69F Series Current-To-Pneumatic Signal Converter
 -
 Foxboro E69F-BI2-S Converter
 -
.jpg) Foxboro H92A049E0700 The host of the DCS control station
Foxboro H92A049E0700 The host of the DCS control station -
 Foxboro H90C9AA0117S Industrial computer workstation
 -
 Foxboro RH101AA High-performance industrial control module
 -
 Foxboro P0922YU FPS400-24 I/A Series Power supply
 -
.png) FOXBORO P0973LN Chassis-based managed switch with independent power supply
FOXBORO P0973LN Chassis-based managed switch with independent power supply -
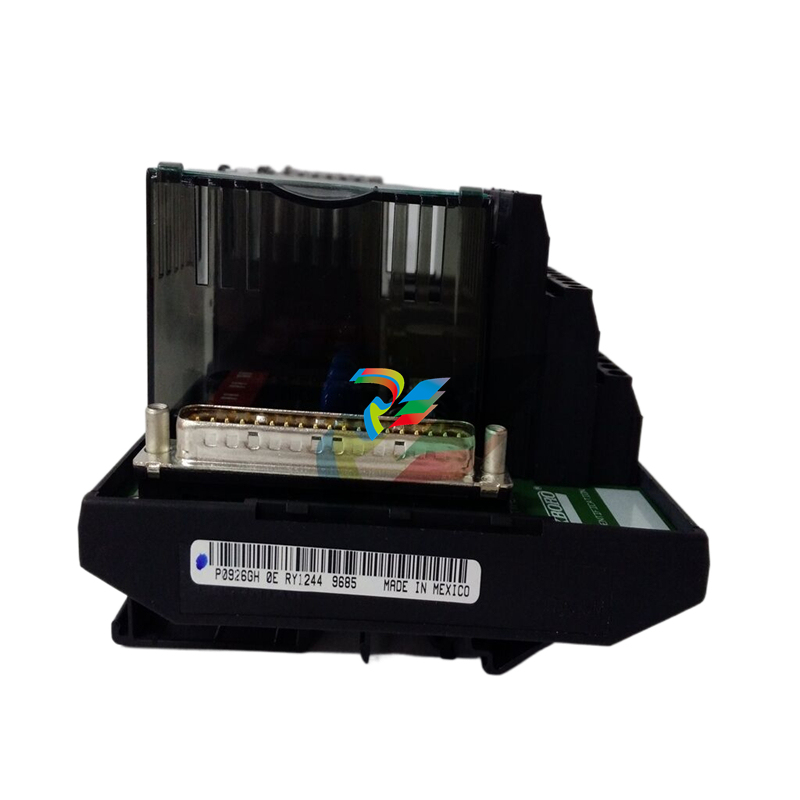
.jpg) FOXBORO P0926PA Input/output module
FOXBORO P0926PA Input/output module -
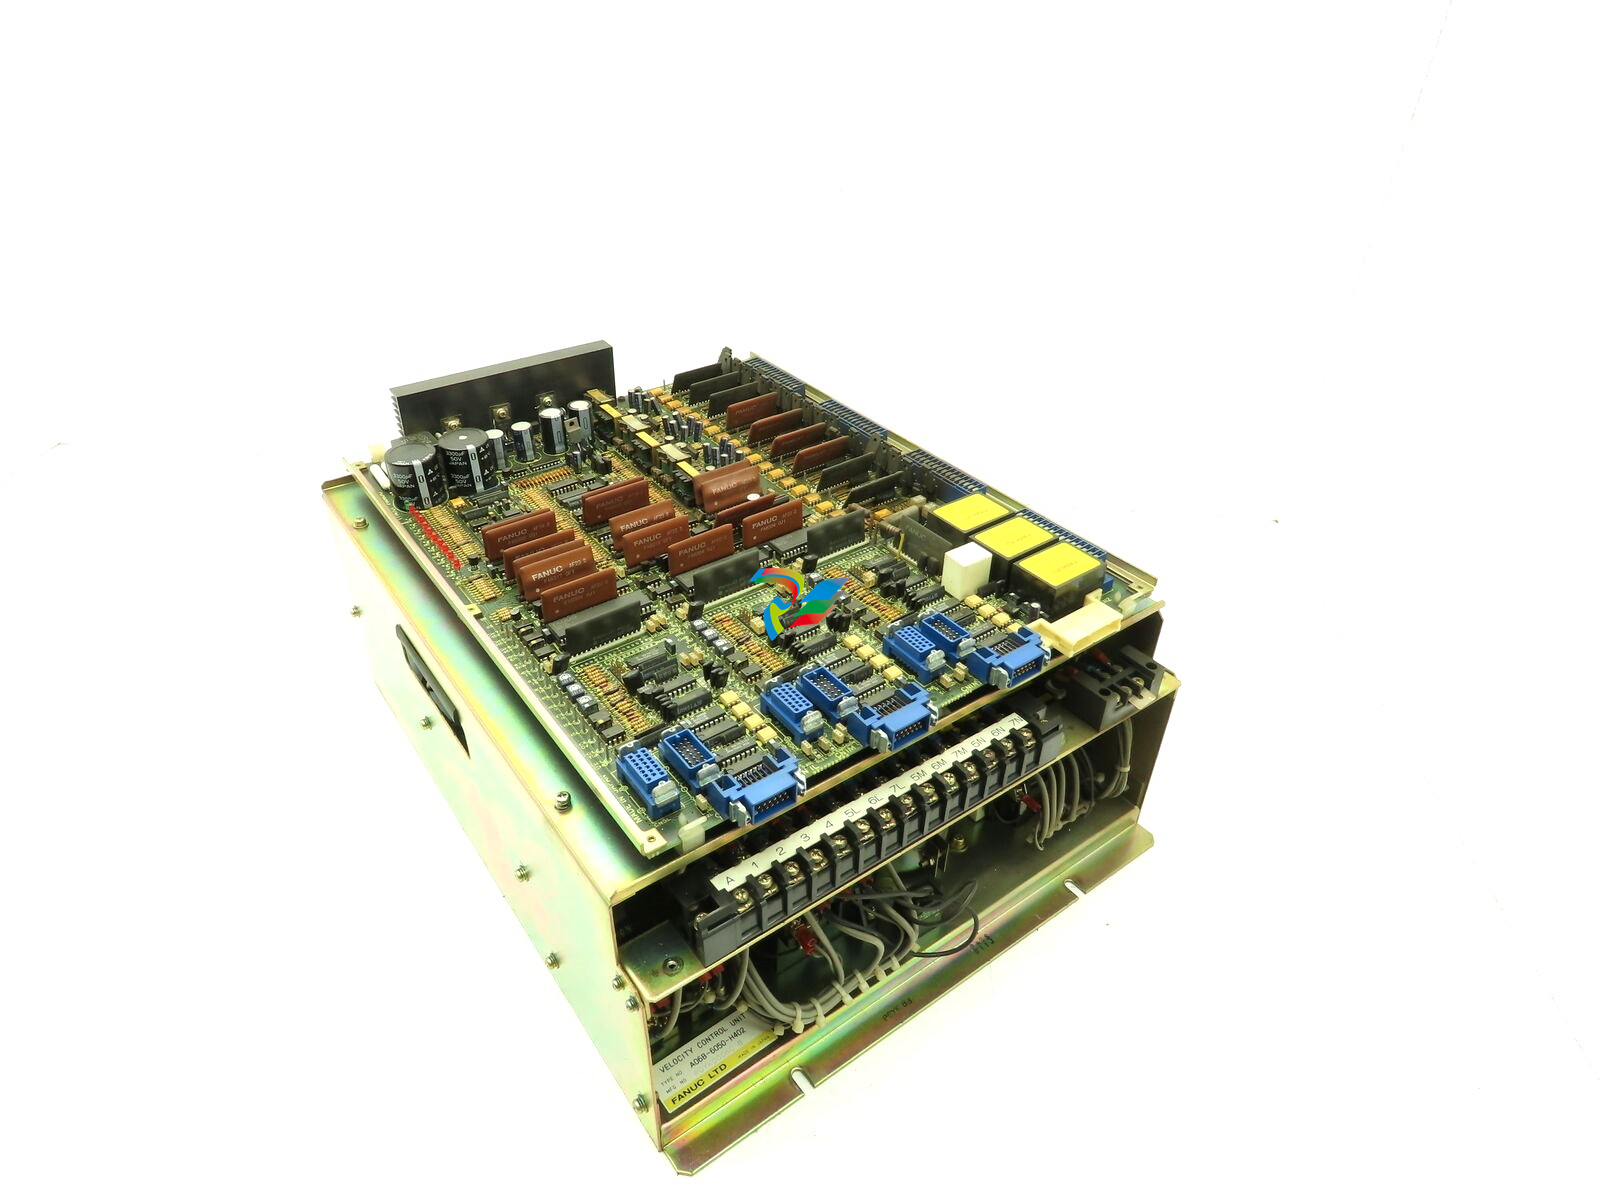 Fanuc A06B-6050-H402 3 AXIS ANALOG AC SERVO DRIVE
 -
.jpg) FOXBORO L0130AD L0130AE-0H Power module group
FOXBORO L0130AD L0130AE-0H Power module group -
_lVjBYb.jpg) FOXBORO 0399085B 0303440C+0303458A Combination Control Module
FOXBORO 0399085B 0303440C+0303458A Combination Control Module -
 FOXBORO SY-0399095E (SY-0303451D+SY-0303460E) Process control board
 -
.jpg) FOXBORO 0399071D 0303440C+0303443B Input/Output (I/O) Module
FOXBORO 0399071D 0303440C+0303443B Input/Output (I/O) Module -
.jpg) FOXBORO RH924UQ Redundant Controller module
FOXBORO RH924UQ Redundant Controller module -
 FFOXBORO E69F-TI2-S current pneumatic converter
 -
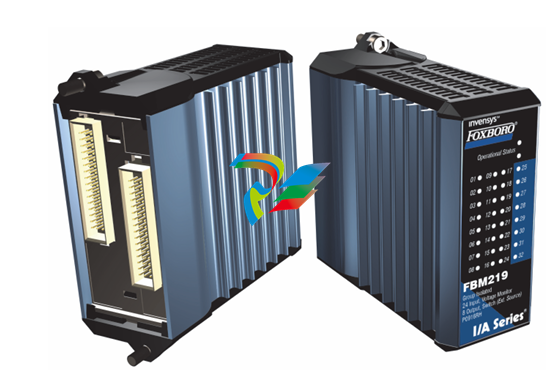 FOXBORO FBM219 RH916RH Discrete I/O Module
 -
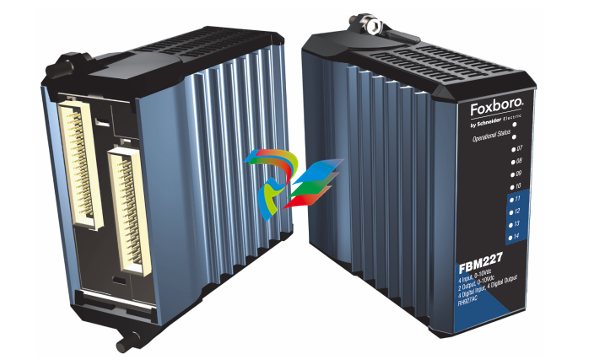 FOXBORO FBM227 P0927AC Module
 -
.jpg) FOXBORO 0399144 SY-0301059F SY-1025115C/SY-1025120E I/O module
FOXBORO 0399144 SY-0301059F SY-1025115C/SY-1025120E I/O module -
.jpg) FOXBORO SY-60399001R SY-60301001RB Industrial Control Module
FOXBORO SY-60399001R SY-60301001RB Industrial Control Module -
 FOXBORO 0399143 SY-0301060R SY-1025115C SY-1025120E Combined control board
 -
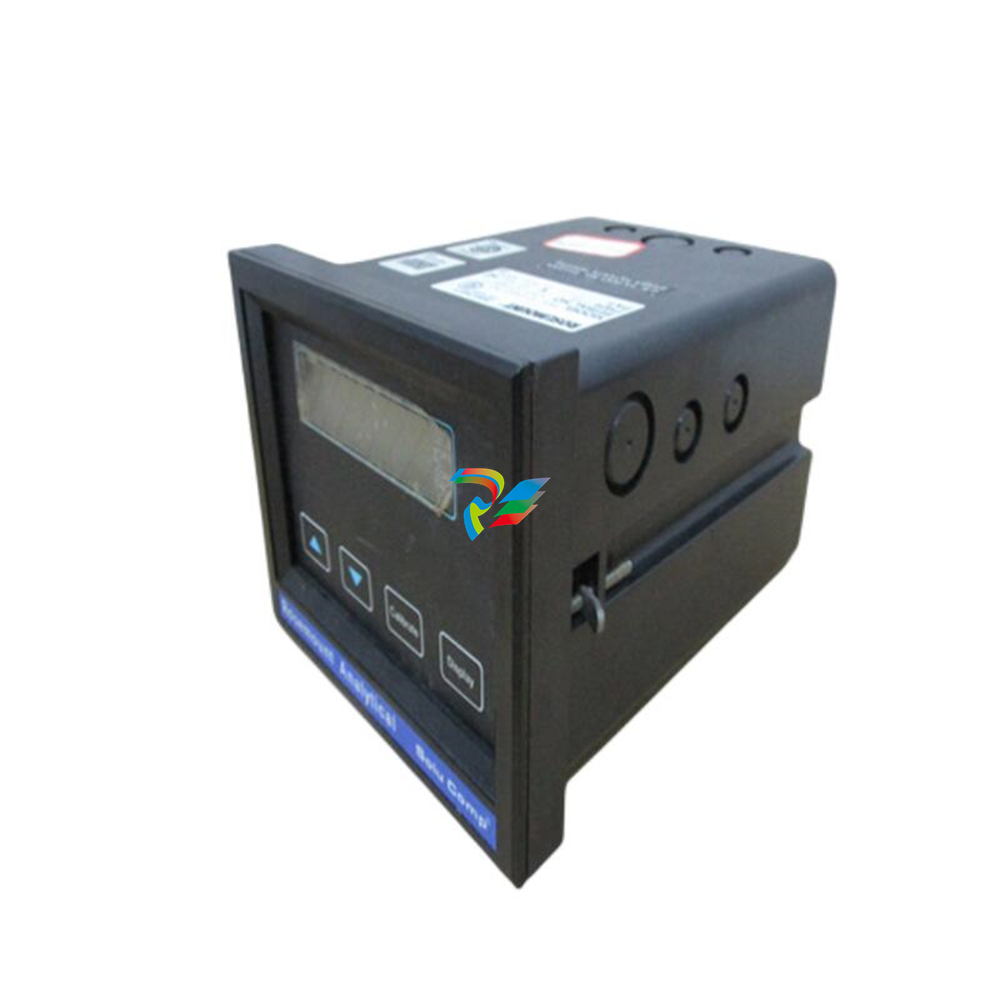
 FOXBORO 873EC-JIPFGZ electrodeless conductivity analyzer
 -
 FOXBORO P0916PH (High-density HART I/O Module)
 -
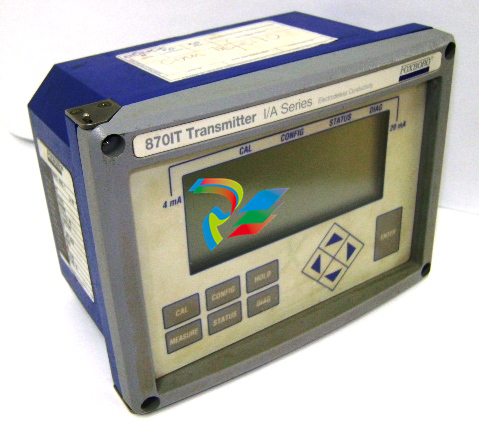 FOXBORO 870ITEC-AYFNZ-7 Intelligent Electrochemical Transmitters
 -
 FOXBORO Compact FBM240. Redundant with Readback, Discrete
 -
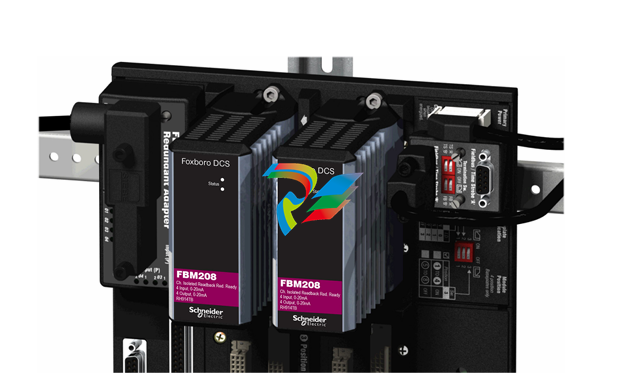 FOXBORO FBM208/b, Redundant with Readback, 0 to 20 mA I/O Module
 -
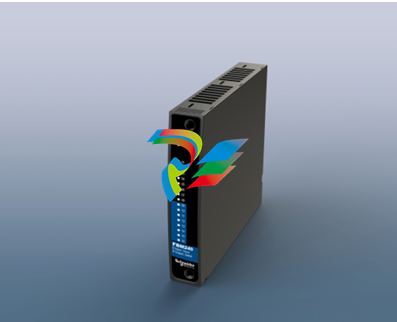
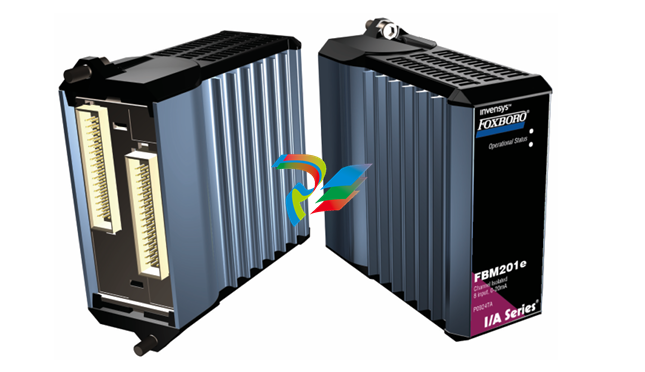 FOXBORO FBM201e Analog Input (0 to 20 mA) Interface Modules
 -
.jpg) FOXBORO P0916WG Terminal cable
FOXBORO P0916WG Terminal cable -
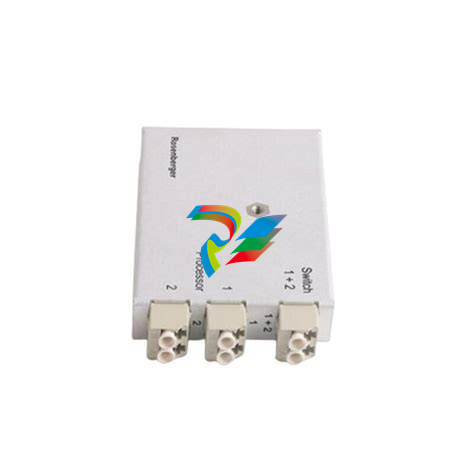 FOXBORO P0926MX 2-Port Splitter
 -
.jpg) FOXBORO AD908JQ High-Frequency Module
FOXBORO AD908JQ High-Frequency Module -
.jpg) FOXBORO AD916CC Processor module
FOXBORO AD916CC Processor module -
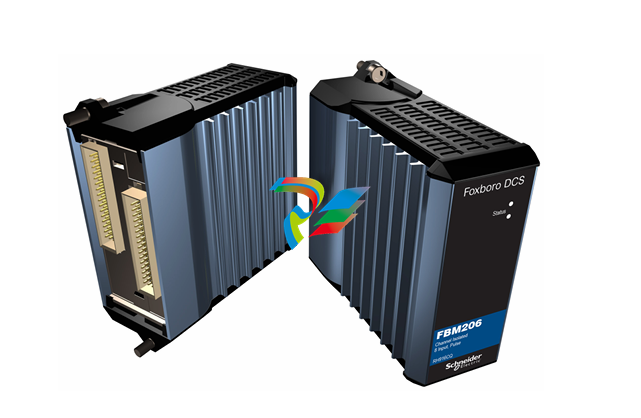 Foxboro DCS FBM206 Pulse Input Module
 -
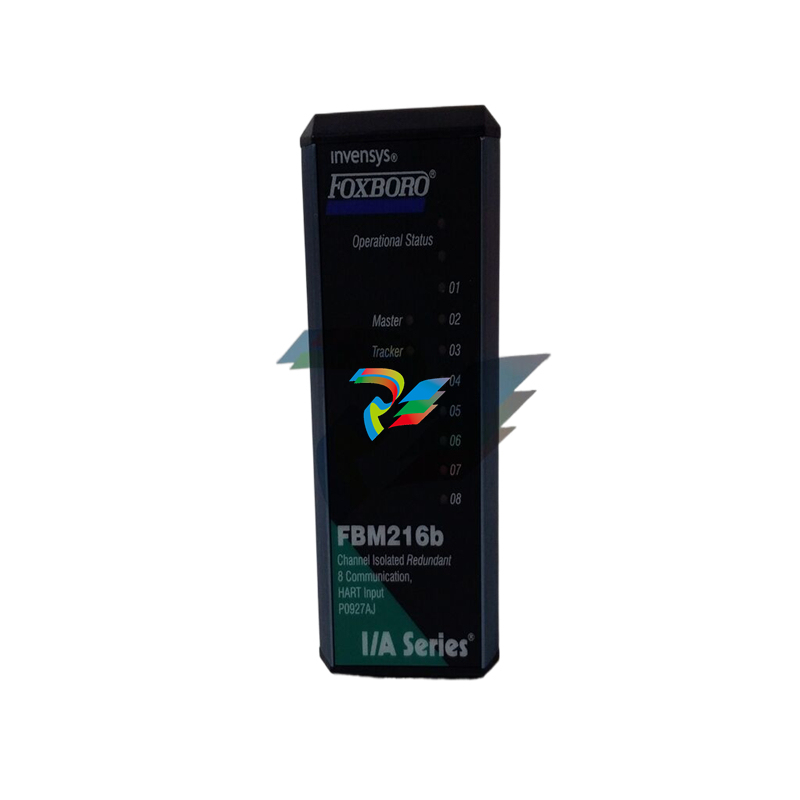
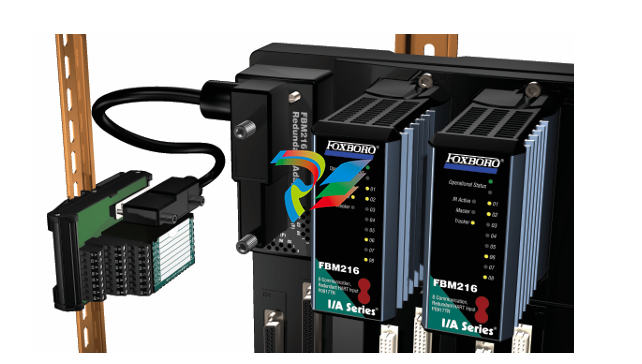 FOXBORO FBM216 HART® Communication Redundant Input Interface Module
 -
 Foxboro p0903nu 1×8 unit sub-component module
 -
 Foxboro P0911SM Industrial control module
 -
 Foxboro CM902WM I/O module
 -
 Foxboro CM902WL Power module
 -
 Foxboro P0972VA Industrial Control Module
 -
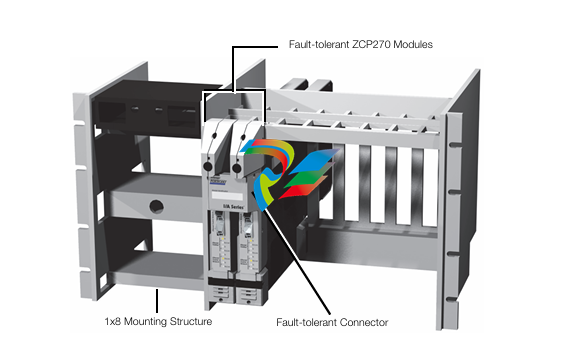
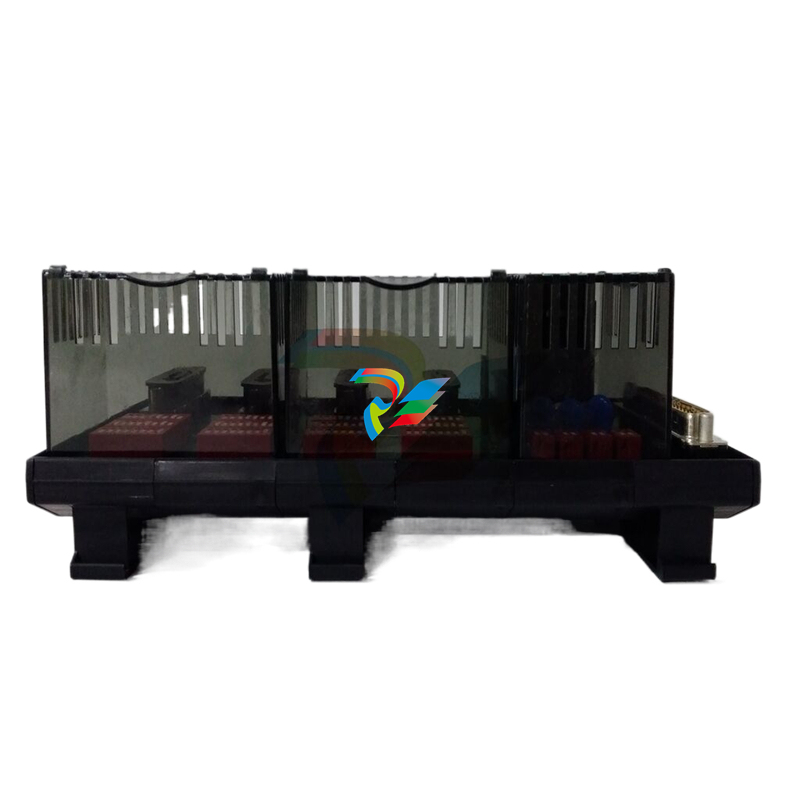
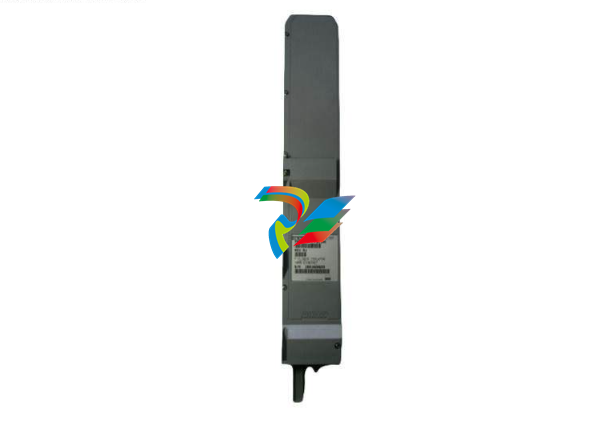
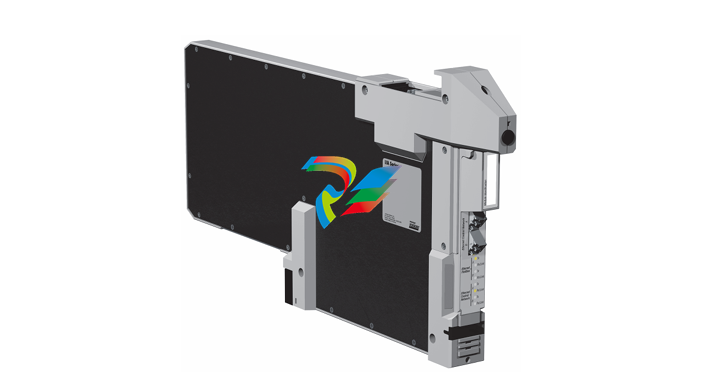 Foxboro Z-Module Control Processor 270 (ZCP270)
 -
 Foxboro PO916JS 16-channel terminal block module
 -
 Foxboro PO911SM High-performance digital/analog input/output module
 -
 Foxboro P0972PP-NCNI Network Interface Module
 -
.jpg) FOXBORO P0971QZ controller module
FOXBORO P0971QZ controller module -
 FOXBORO P0971DP Thermal resistance input/output module
 -
 FOXBORO P0970VB Cable connector
 -
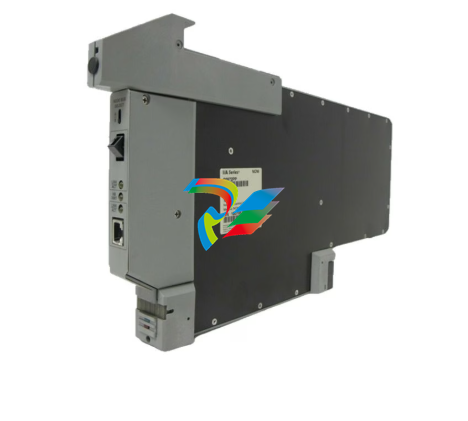
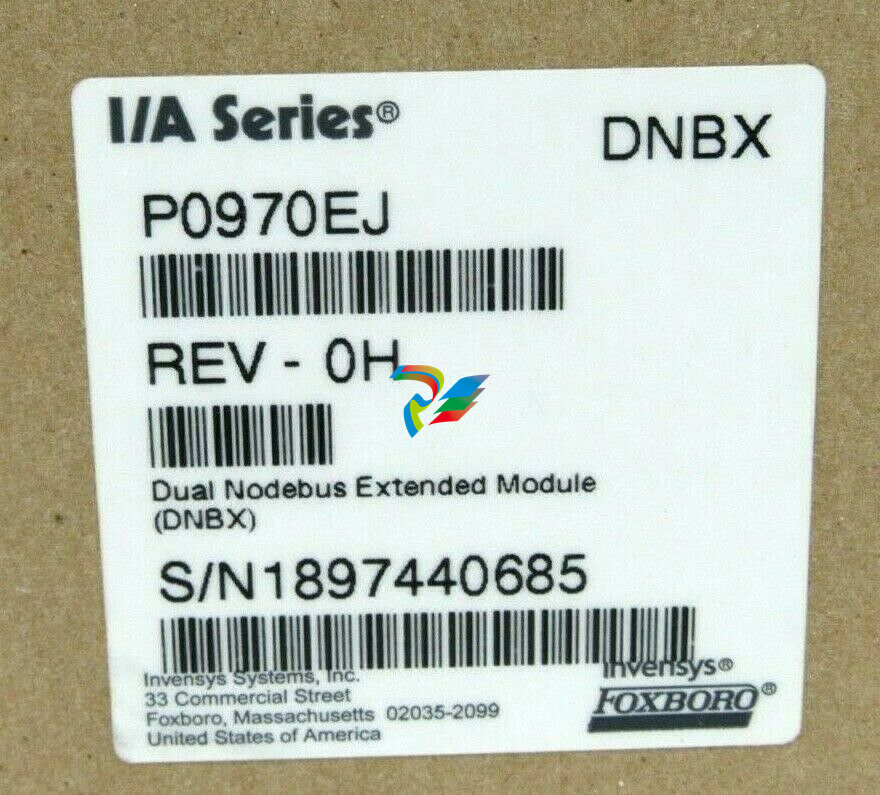 FOXBORO P0970EJ-DNBX Dual-node bus expansion module
 -
 FOXBORO P0970BP Redundant power supply system
 -
.jpg) FOXBORO P0970BC-DNBI DeviceNet bus interface module
FOXBORO P0970BC-DNBI DeviceNet bus interface module -
.jpg) FOXBORO P0961FX-CP60S Main control CPU module
FOXBORO P0961FX-CP60S Main control CPU module -
.jpg) FOXBORO P0961EF-CP30B Network Interface Unit
FOXBORO P0961EF-CP30B Network Interface Unit -
.jpg) FOXBORO P0961CA Optical fiber local area network module
FOXBORO P0961CA Optical fiber local area network module -
.jpg) FOXBORO P0961BD-GW30B gateway processor module
FOXBORO P0961BD-GW30B gateway processor module -
.jpg) FOXBORO P0961BC-CP40B/I/A Series high-performance control processor module
FOXBORO P0961BC-CP40B/I/A Series high-performance control processor module -
FOXBORO P0960JA-CP40 High-performance control processor
-
FOXBORO P0926TM Control module
-
 FOXBORO P0916BX Termination Assembly
 -
.jpg) FOXBORO P0916AE P0916AG P0916AW Thermal resistance input type DCS card module
FOXBORO P0916AE P0916AG P0916AW Thermal resistance input type DCS card module -
 FOXBORO P0916AC FOXBORO distributed control system (DCS) compression terminal assembly
 -
.jpg) FOXBORO P0912CB High-performance interface module
FOXBORO P0912CB High-performance interface module -
.jpg) FOXBORO P0911VJ Thermal resistance input output module
FOXBORO P0911VJ Thermal resistance input output module -
.jpg) FOXBORO P0911QH-A High-precision module
FOXBORO P0911QH-A High-precision module -
 FOXBORO P0911QB-C P0911QC-C Thermal resistance input/output module
 -
 FOXBORO P0904BH P0904FH P0904HB Distributed Control system (DCS) module
 -
 FOXBORO P0903ZP P0903ZQ Embedded System Debugging Module
 -
 Foxboro P0903ZL P0903ZN Industrial power module
 -
 Foxboro P0903ZE I/A Series Fieldbus Isolator Module
 -
 FOXBORO P0903NW Industrial Control Module